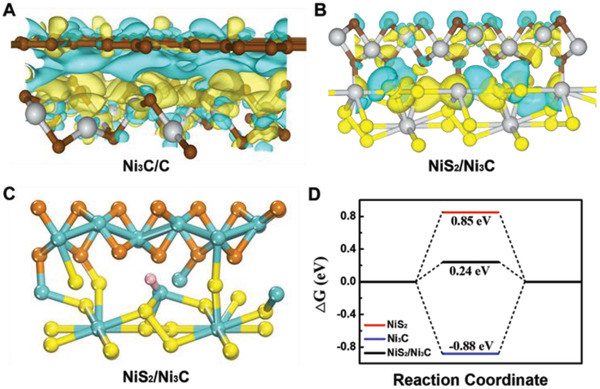
Figure 4.

DFT calculations of charge transfer difference and ΔG H* of NiS2/Ni3C@C. Calculated charge transfer difference for A) Ni3C/C and B) NiS2/Ni3C heterojunctions at top views, where the yellow and blue areas refer to the charge accumulation and depletion, respectively. C) The theoretical models used in ΔG H*. The blue, yellow, brown, and pink balls indicate Ni, S, C, and H atoms, respectively. D) The calculated Gibbs free‐energy diagram of hydrogen evolution reaction (HER) at different active sites.
