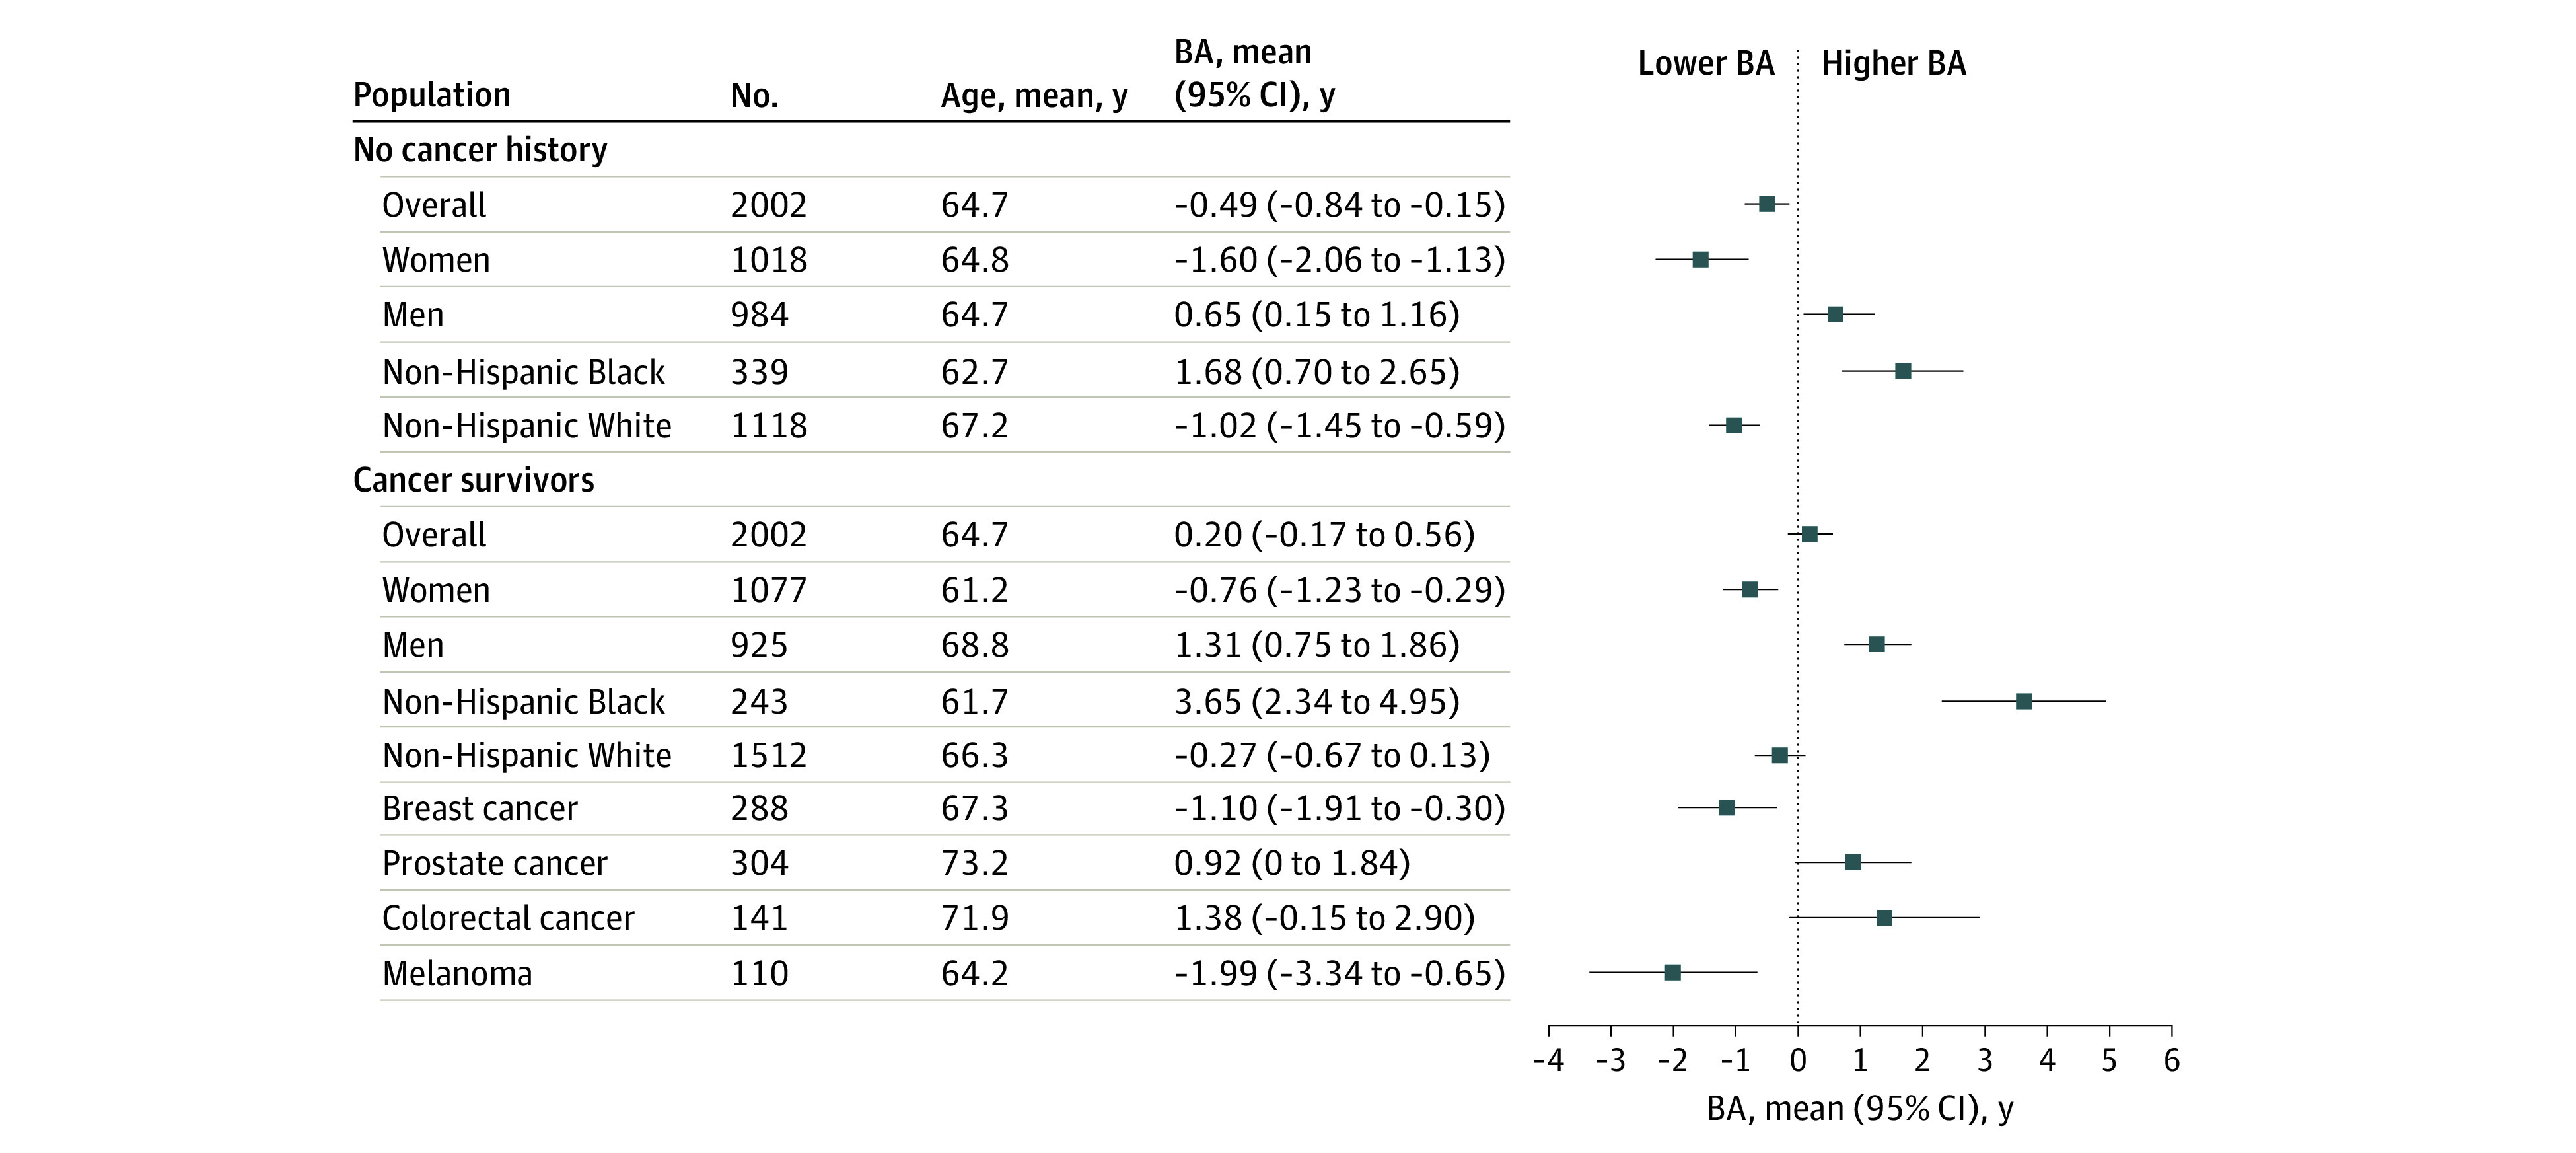
Figure. Forest Plot of Biological Aging (BA) by Subpopulation.

The figure shows number of participants, mean age at baseline, and mean value with 95% CI of BA by subpopulation. For sample size consideration, BA was summarized only for non-Hispanic White and Black participants when summaries were conducted by racial and ethnic group.
