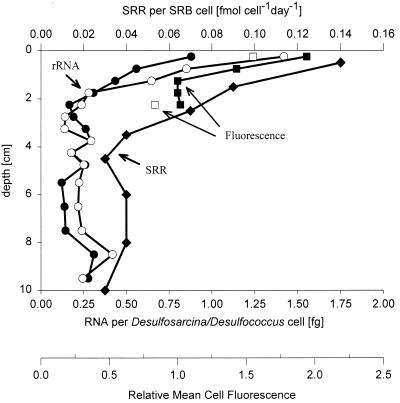
FIG. 6.
Depth profiles for specific rRNA contents and mean cell fluorescence for DSS658 (Desulfosarcina-Desulfococcus group)-targeted cells and SRRs per SRB cell. The average cellular rRNA contents were determined by combining FISH and rRNA hybridization data (●, core A; ○, core B). The mean fluorescence of hybridized cells was quantified by laser scanning microscopy in the following way. For each depth a mean cell fluorescence was calculated; the lowest mean cell fluorescence value was defined as 1, and the mean fluorescence values for cells in the other layers were expressed relative to this value (■, core A; □, core B). SRRs per SRB cell (⧫) were based on SRB abundance.

