Figure 6.
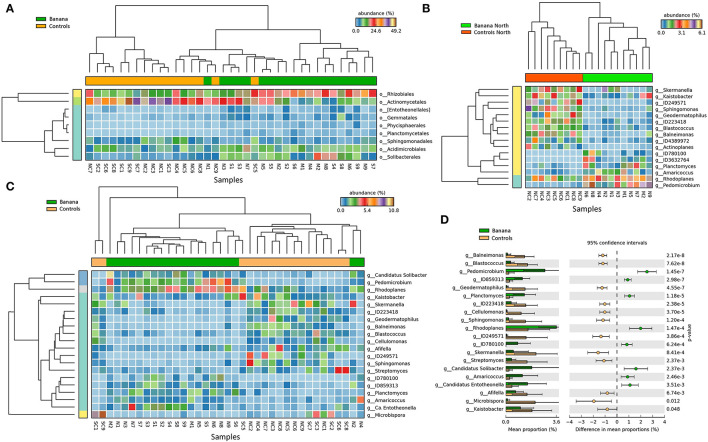
Heatmaps of 16S rRNA sequence abundance among all samples (A,C), and in a subset of northern samples (B), showing the separation of taxa between banana plant rhizosphere and adjacent controls, at the order (A) and genus (B,C) levels (filtered at p < 0.05, effect size filter for difference or proportions = 0.8). Extended error bar plot showing the mean sequence proportions for differentially represented bacterial taxa (p < 0.05), at the genus level (D).

