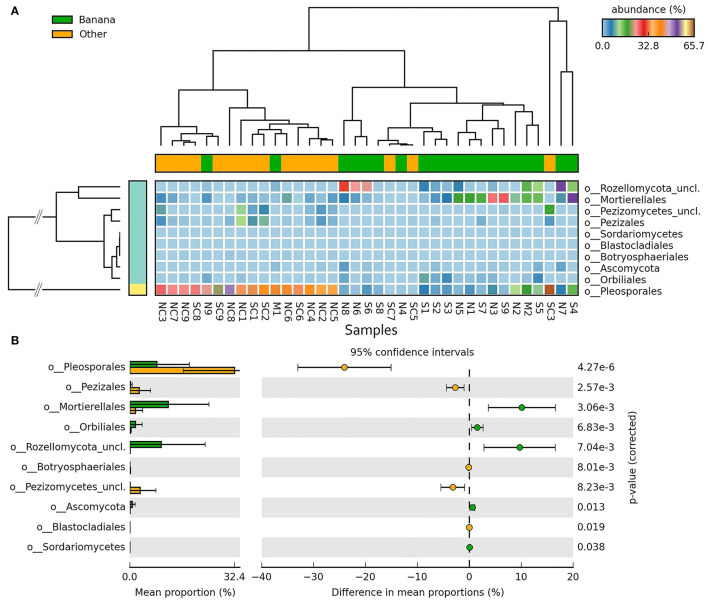
Figure 8.
Heatmaps of ITS sequence abundance among all samples showing the differential groupings of fungi between banana plants rhizosphere and adjacent controls, at the order level (A), shown by hierarchical cluster analysis (filtered at p < 0.05, effect size filter for difference or proportions = 0.8). Error bar plots of differences in mean proportions among samples (B).

