
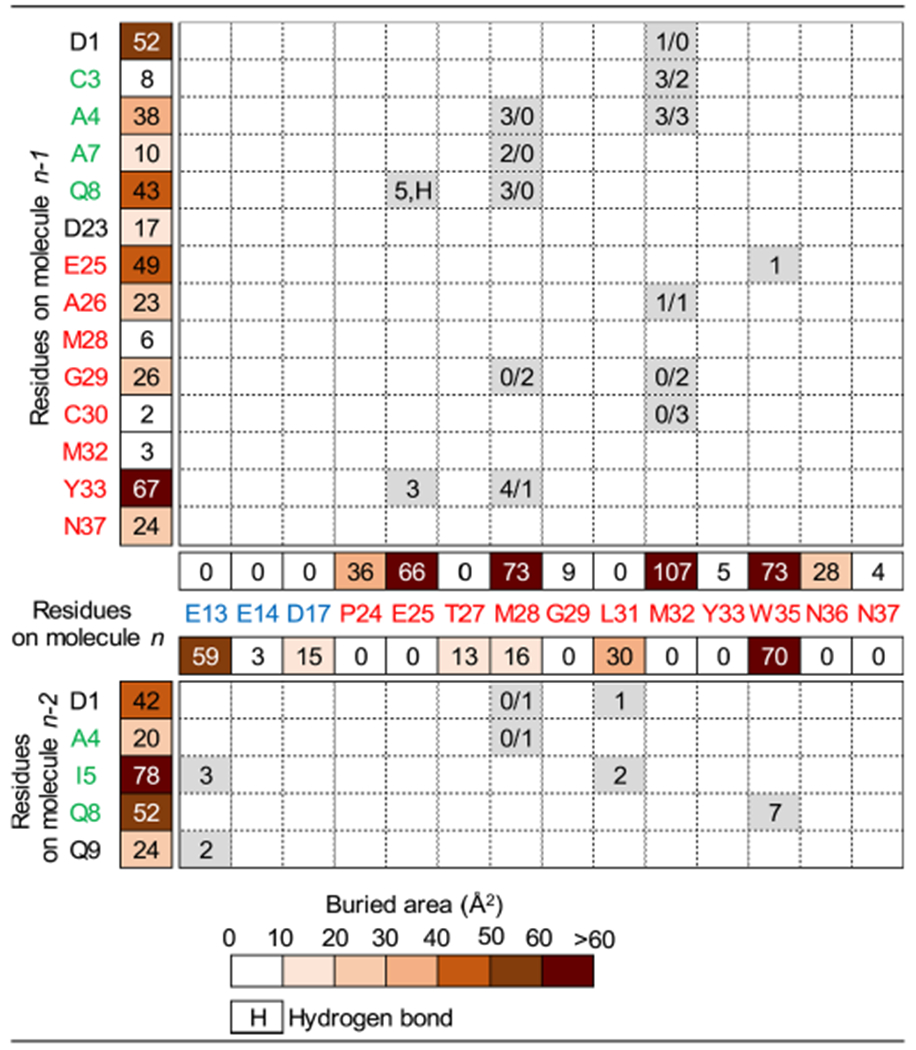
Table 2.
Characterization of the Er-13 crystal structure interfaces. The upper part of the table relates to interface #1 between molecules n and n – 1, while the lower part relates to interface #2 between molecules n and n – 2 (see Fig. 3A). The surface areas buried on each residue in the interface formation are reported and color coded as indicated. The numbers of heavy atom contacts between pairs of residues are specified within the corresponding boxes, and for residues M28 and M32 (on molecule n) the two numbers refer to the A and B conformations. In the box corresponding to the Q8/E25 residue pair, the letter H indicates one hydrogen bond. Residues written in green lie on helix-1, in blue on helix-2, and in red on helix-3.
|