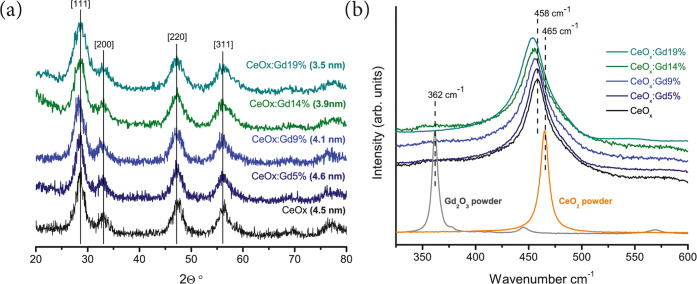
Figure 1.
(a) X-ray diffraction patterns of CeOx, CeOx:Gd5%, CeOx:Gd9%, CeOx:Gd14%, and CeOx:Gd19%. The calculated grain sizes as determined by the Scherrer equation are given. (b) Raman spectra for CeO2, Gd2O3, CeOx, CeOx:Gd5%, CeOx:Gd9%, CeOx:Gd14%, and CeOx:Gd19%. The Raman spectra are normalized and vertically shifted using a small offset for each spectrum to facilitate line shape comparison. There is an increasing shift of the main Raman peak to lower wavenumbers related to the integration of Gd.

