
Figure 2.
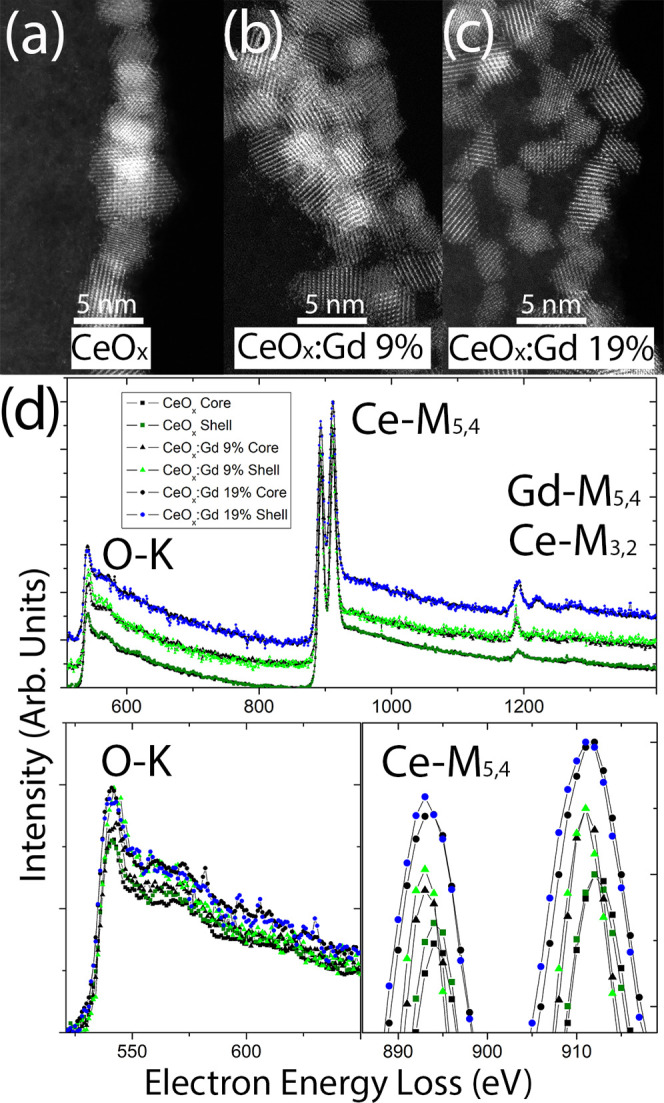
(a–c) High-resolution HAADF-STEM images of the CeOx, CeOx:Gd9%, and CeOx:Gd19% particles, respectively. (d) Vertically shifted core-loss EEL spectra (top) for the same samples, with emphasis on baseline aligned the O-K (bottom left) and vertically shifted Ce-M (bottom right) edges.