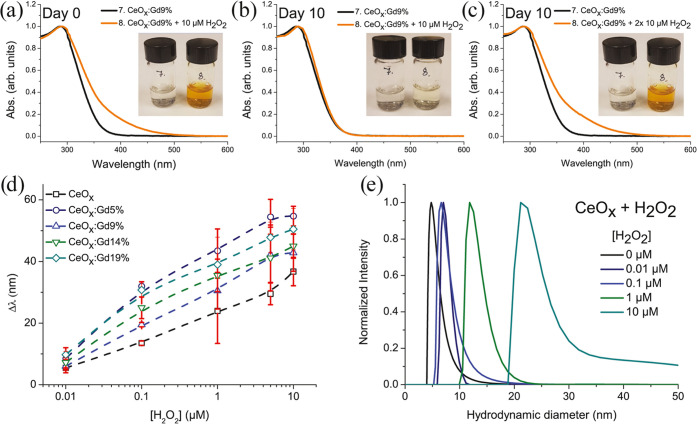
Figure 4.
Absorbance spectra and inserted images of CeOx:Gd9% untreated and treated with 10 μM H2O2 on (a) day 0, (b) day 10, and (c) on day 10, another 10 μM H2O2 was added to the sample. (d) Plotted red shifts CeOx:Gd0–19% ([Ce] = 10 μg mL–1) treated with increasing concentration of H2O2. (e) Hydrodynamic diameter of CeOx treated with H2O2 (number-weighted distributions). The photos in panels (a)–(c) courtesy of the first author, P. Eriksson. Copyright 2020.

