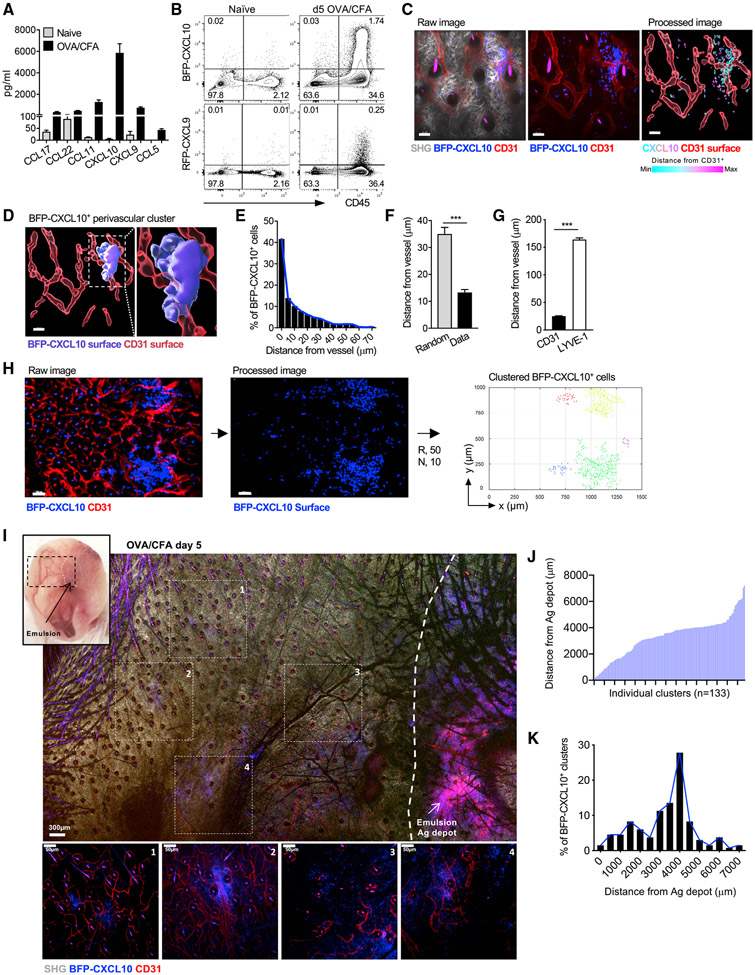
Figure 1. Th1 accumulation at perivascular BFP-CXCL10+ clusters within the inflamed ear.
(A) Chemokine protein levels from day 3 OVA/CFA-immunized WT ears. Day 5 OVA/CFA immunization of REX3 mice, cells in inflamed ears.
(B) Frequency of BFP-CXCL10 and RFP-CXCL9 expressing hematopoietic cells. Representative from five independent experiments, >20 REX mice per group. Day 5 OVA/CFA immunization of REX3 mice, cells in inflamed ears.
(C) Distribution of BFP-CXCL10+ cells (blue) and CD31+ vessels (red) by IV-MPM in the dermis: gray, SHG; scale bar, 50 μm. Processed image: CD31+ vessels (red) reconstructed and volumetrically rendered in 3D using Imaris; BFP-CXCL10+ cells color coded by distance from vessel. Representative maximal z projection image, four independent experiments, 12 ears, >25 imaging volumes. Day 5 OVA/CFA immunization of REX3 mice, cells in inflamed ears.
(D) 3D surface rendering of BFP-CXCL10+ perivascular cluster (Imaris). Day 5 OVA/CFA immunization of REX3 mice, cells in inflamed ears.
(E and F) Frequency distribution of BFP-CXCL10+ cells from CD31+ vessels (E). BFP-CXCL10+ cell distance from CD31+ vessels (Data) compared to random distribution in same imaging volume (Random) (F). (E and F) Three independent experiments, 10 ears, 20 imaging volumes. Day 5 OVA/CFA immunization of REX3 mice, cells in inflamed ears.
(G) BFP-CXCL10+ cell distance from CD31+ and LYVE-1+ vessels. Two independent experiments, five ears, 10 imaging volumes. Day 5 OVA/CFA immunization of REX3 mice, cells in inflamed ears.
(H) Tiled image of six imaging fields of 512 (x) × 512 (y) × 60 (z) μm; scale bar, 100 μm; raw and processed images as in (C). Right panel, semi-automated 3D cluster reconstruction using DBSCAN-based algorithm: R, radius from cell centroid (μm); N, number of neighbors within the radius. Each dot represents a single detected BFP-CXCL10+ cell within the identified clusters, with each cell in the same cluster designated a cluster-specific color. Day 5 OVA/CFA immunization of REX3 mice, cells in inflamed ears.
(I) Tissue-wide cluster distribution relative to the OVA/CFA emulsion (Ag depot, highly auto-fluorescent), IV-MPM tiled image of region highlighted in upper-left picture using a 10× objective; scale bar, 300 μm. Individual images (1–4) acquired with 25× objective (below); scale bar, 50 μm. Day 5 OVA/CFA immunization of REX3 mice, cells in inflamed ears.
(J and K) Individual cluster distance (J) and frequency of BFP-CXCL10+ cell distance (K) from Ag depot. Cluster identified using DBSCAN-based algorithm (H) and distances calculated between the center of the cluster and emulsion. Three independent experiments, 133 clusters, >20 imaging volumes. Day 5 OVA/CFA immunization of REX3 mice, cells in inflamed ears (J).

