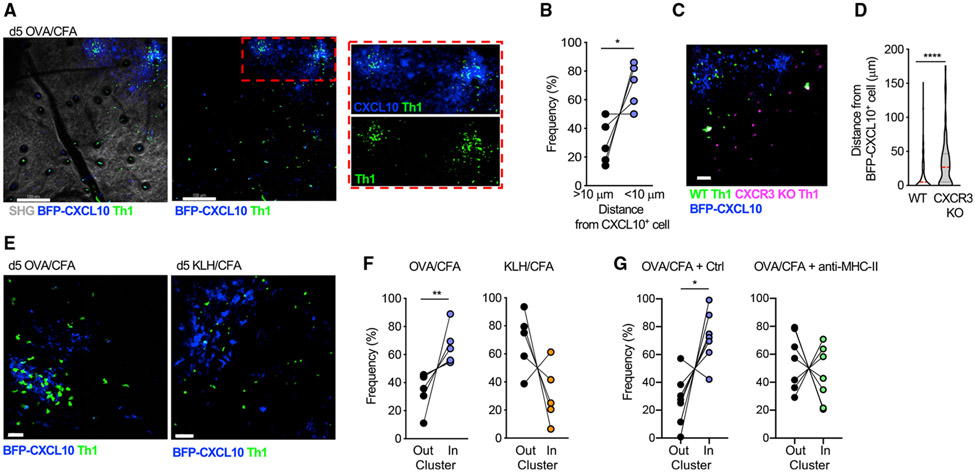
Figure 2. Th1 cell spatial preference.
OT-II Th1 cells were transferred i.v. into OVA/CFA-immunized REX3 mice, and their position relative to the BFP-CXCL10+ clusters was determined on day 5 of immunization by IV-MPM of the inflamed ear dermis.
(A) OT-II Th1 cells (green) localized to BFP-CXCL10+ clusters (blue). Maximal z projection by IV-MPM: gray, SHG; scale bar, 100 μm.
(B) Frequency of OT-II Th1 cells within 10 μm of BFP-CXCL10+ cells, with paired data points from the same imaging field. Pooled data from three independent experiments, >15 imaging volumes.
(C and D) Co-transferred WT (green) and CXCR3 KO (magenta) OT-II Th1 cells relative to BFP-CXCL10+ cells (blue). Representative maximal z projection by IV-MPM; scale bar, 50μm. (D) WT and CXCR3-KO OT-II Th1 cell distance from BFP-CXCL10+ cells. Pooled data from three independent experiments, >15 imaging volumes.
(E and F) Immunization with cognate (OVA/CFA) or non-cognate (KLH/CFA) antigen and transfer of OVA-specific OT-II Th1 cells. (E) Representative maximal z projection by IV-MPM; scale bar, 50 μm; and (F) frequency of OT-II Th1s (green) relative to BFP-CXCL10+ clusters (blue).
(G) After Th1 transfer and immunization with OVA/CFA, mice were treated i.d. in the ear with isotype control or anti-MHC-II Ab 6 h before imaging. The position of Th1 cells relative to the BFP-CXCL10+ cluster was analyzed as in (E) and (F). Data from 2–3 independent experiments.
Statistics: Mann-Whitney (D) or paired t test (B, F, and G), *p ≤ 0.05, **p ≤ 0.01, ***p ≤ 0.001.

