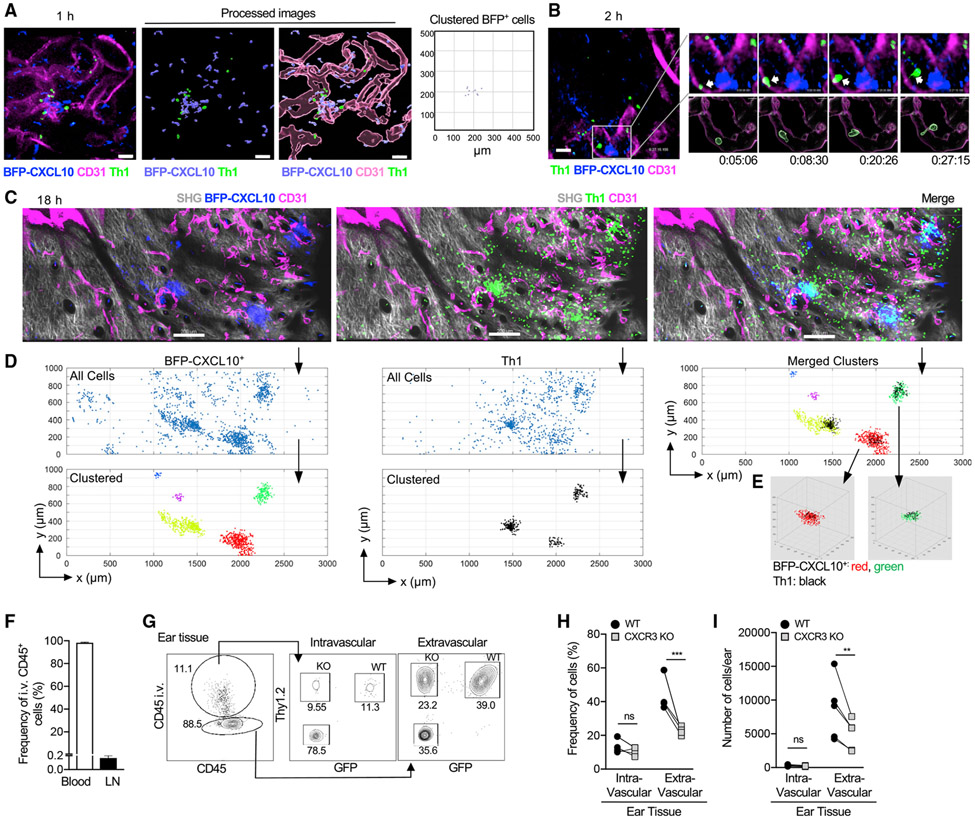
Figure 3. Th1 cells preferentially enter the skin at BFP-CXCL10+ clusters in a CXCR3-mediated manner.
Fluorescently labeled OT-II Th1 cells were transferred i.v. into day-5 OVA/CFA-immunized REX3 mice, and IV-MPM of inflamed dermis was performed hours after cell transfer.
(A) 1 h after Th1 cell (green) transfer, CD31+ vessel (magenta), BFP-CXCL10+ cells (blue); scale bar, 50 μm. Right panel, BFP-CXCL10+ cluster identification using the DBSCAN-based algorithm.
(B) 2 h after Th1 cell (green) transfer, CD31+ vessel (magenta), BFP-CXCL10+ cells (blue); scale bar, 50 μm. Insert (upper right): time-lapse images of Th1 cell (arrow) transmigrating a CD31+ vessel. Processed images (lower right): CD31+ vessels reconstructed and volumetrically rendered in 3D using Imaris.
(C–E) 18 h after Th1 cell (green): gray, SHG; scale bar, 200 μm. Representative of two independent experiments, three mice, six imaging volumes (C). (D) Cluster identification in 3D using DBSCAN-based algorithm of BFP-CXCL10+ cells (left) and OT-II Th1 cells (middle) from (C) (R = 50 μm, N = 10 neighbors). Top panels, all cells; bottom panels, clustered cells. Merged clusters (top, right). (E) 3D representation of BFP-CXCL10+:T cell co-clusters from (D).
(F–I) Co-transferred WT (Thy1.2+ GFP+) and CXCR3 KO (Thy1.2+ GFP−) OT-II Th1 cells in OVA/CFA-immunized Thy1-congenic mice, acutely labeled with anti-CD45 Ab 2 min before sacrifice. (F) Acute CD45 labeling of circulating leukocytes (blood) and tissue leukocytes (LN). (G) Representative plots of CD45 labeling in the inflamed ear pinna of endogenous T cells (Thy1.2−) and co-transferred WT(Thy1.2+ GFP+) and CXCR3 KO(Thy1.2+ GFP−) OT-II cells, (H) frequency and (I) number of intravascular (CD45+) versus extravascular Th1 cells. Three independent experiments, three to five mice/experiment.
Stats by paired t test (H and I), ns, p > 0.05, **p ≤ 0.01, ***p ≤ 0.001.

