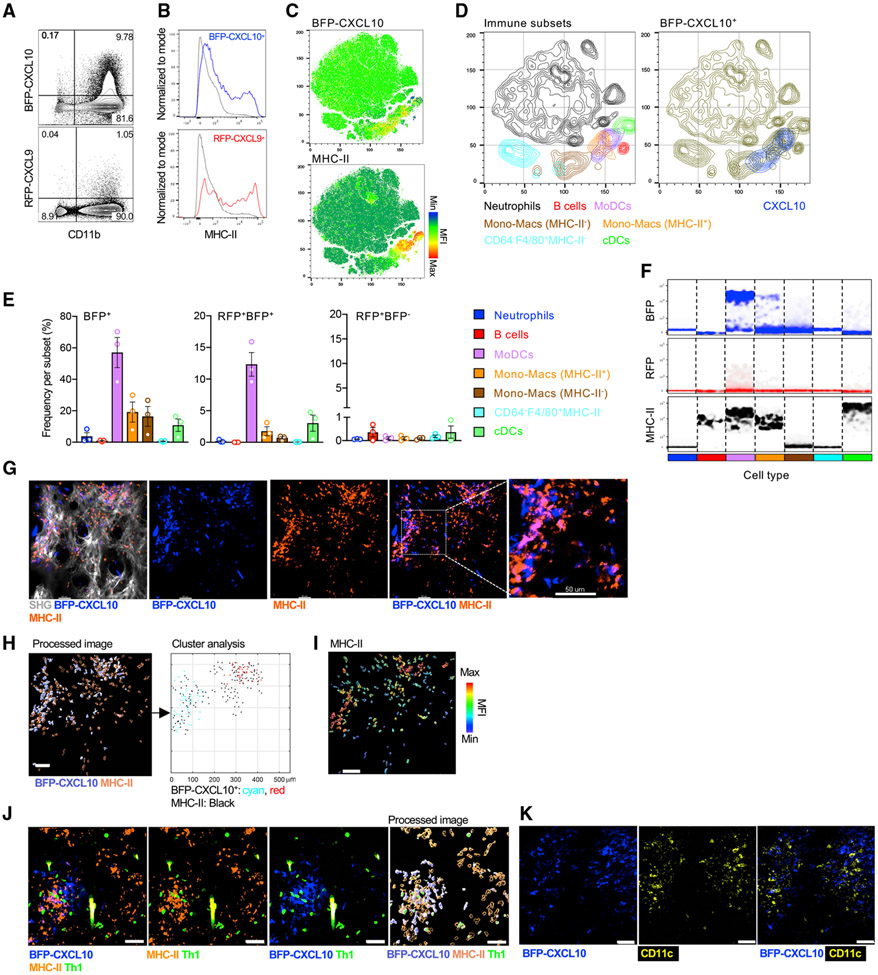
Figure 4. BFP-CXCL10+ myeloid cell clusters enriched for CD11c+MHC-H+ cells.
(A) Representative dot plots of BFP-CXCL10 and RFP-CXCL9 expression by CD11b+ cells within the day-5 OVA/CFA-immunized REX3 dermis.
(B) Representative histograms of MHC-II expression by BFP-CXCL10+ (blue) and BFP-CXCL9+ (red) CD45+ cells from (A). Gray: RFP-CXCL9− BFP-CXCL10− CD45+ cells.
(C) tSNE analysis on singlet live CD45+ cells using concatenated multi-color flow cytometry data.
(D) Immune subsets gated by manual flow cytometry analysis displayed on tSNE plots (left). Overlay of BFP-CXCL10+ cells (right).
(E) Frequency of BFP-CXCL10+ cells (left), BFP-CXCL10+RFP-CXCL9+ cells (middle). and BFP-CXCL10−RFP-CXCL9+ cells (right) within each of the immune subsets in (D). Bars represent means ± SEM of three independent experiments, three to four mice/experiment.
(F) Density plots for BFP-CXCL10, RFP-CXCL9, and MHC-II within each subtype in (E).
(G–I) MHC-II+ (orange) staining relative to the BFP-CXCL10+ cluster (G), cluster analysis of BFP-CXCL10+ and MHC-II+ cells (H), MHC-II MFI of cells (I) relative to the BFP-CXCL10+ clusters in (H). Representative maximal z projection images by IV-MPM from two independent experiments, two to three mice/imaging session, >10 imaging volumes; scale bar, 50 μm.
(J) Colocalization of MHC-II+, BFP-CXCL10+ and Th1 cells. Right panel (processed image), cluster analysis of MHC-II and BFP-CXCL10 cells using the DBSCAN-based algorithm. Representative maximal z projection images by IV-MPM from two independent experiments, two to three mice/imaging session, >10 imaging volumes; scale bar, 50 μm.
(K) CD11c+ (yellow) cells relative to BFP-CXCL10+ clusters (blue); day-5 OVA/CFA-immunized REX3 ears.

