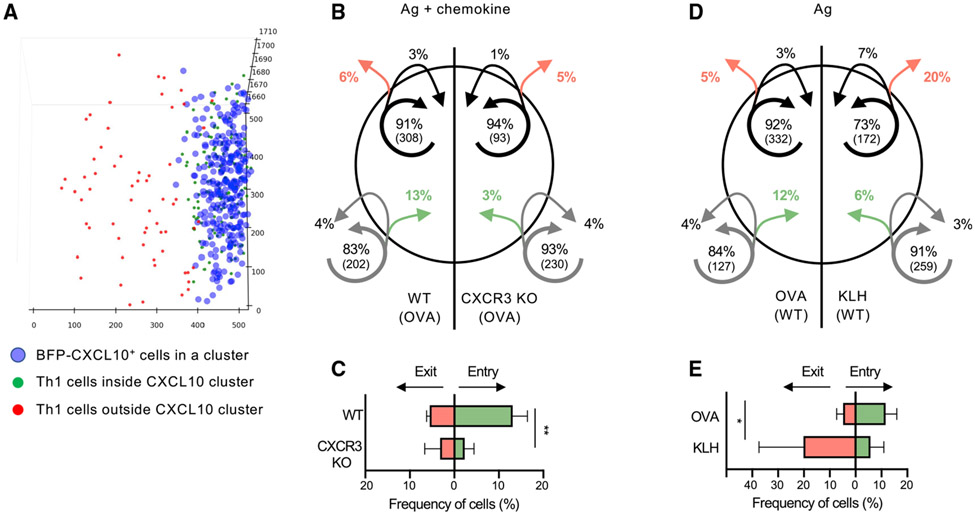
Figure 5. Distinct roles for CXCR3 and cognate antigen in cluster dynamics.
IV-MPM analysis of Th1 cell movement in the dermis of REX3 day 5 OVA/CFA- or KLH/CFA-immunized mice. Virtual 3D BFP-CXCL10+ clusters defined as in Figure 1. OT-II Th1 entry and exit from BFP-CXCL10+ clusters was tracked over a 60-min imaging period.
(A) Representative semi-automated DBSCAN identification of the CXCL10+ cells (blue) in the chemokine cluster and designation of Th1 cell location in (green) or out (red) of the chemokine cluster at the start of the imaging period.
(B) Movement of co-transferred WT (left) and CXCR3-KO OT-II Th1 (right) cells in the dermis of OVA/CFA-immunized mice. The circle represents the BFP-CXCL10+ cluster. Arrows indicate the movement of cells relative to the BFP-CXCL10+ cluster: green, entered the cluster; red, exited the cluster. Arrow tail position indicates the region in which the track began, whereas arrow head position indicates the region in which the track ended over the 60-min imaging window. Shown are averaged percentages of cells from each genotype that exhibited the same pattern of movement. Numbers in parentheses indicate numbers of cells in each compartment.
(C) Frequency of cell entry and exit from the BFP-CXCL10+ clusters as in (B).
(D and E) Pattern of movement of WT OT-II Th1 cells into and out of BFP-CXCL10+ clusters in the dermis of OVA/CFA (left) or KLH/CFA (right), analyzed as in (B). Pooled data from three independent experiments; three to six mice/group. Bars represent means ± SEM. Statistics by two-way ANOVA, *p < 0.05, **p < 0.01.

