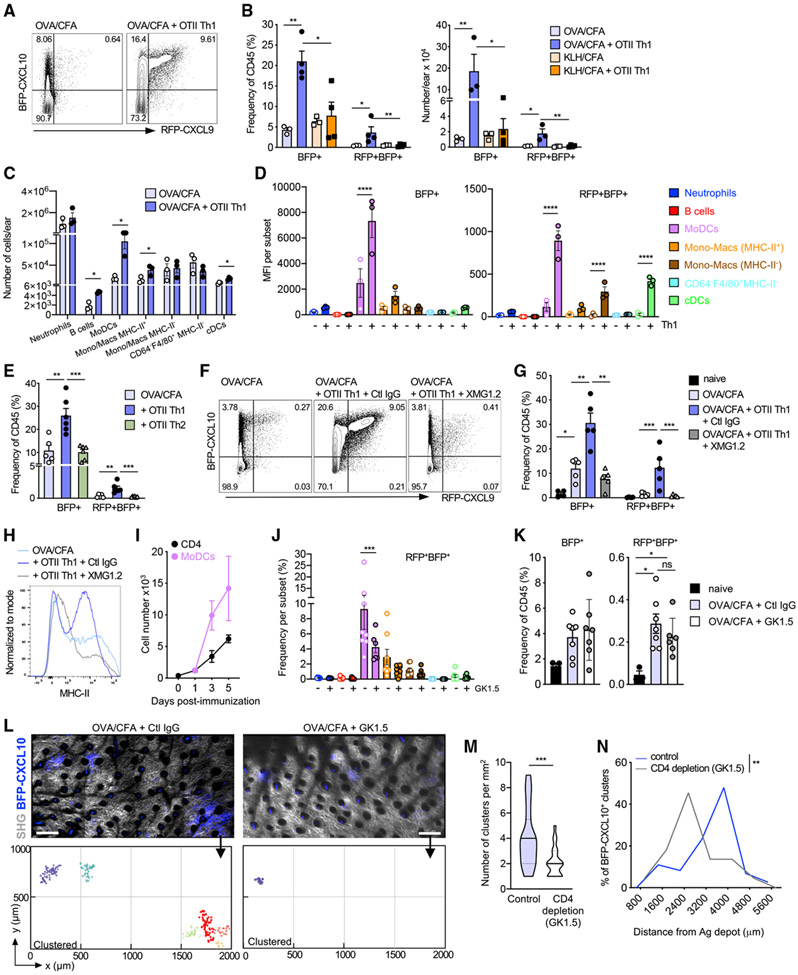
Figure 7. IFNγ-dependent T cell amplification of the chemokine-rich niches.
(A) Representative plots of BFP-CXCL10 and RFP-CXCL9 expression of day 5 OVA/CFA-immunization ± OT-II Th1 transfer day 3 after immunization. Three independent experiments; three to four mice/group per experiment.
(B) Frequency (left) and number (right) of CD45+ BFP-CXCL10+ and BFP-CXCL9+ BFP-CXCL10+ cells in mice immunized with OVA/CFA or KLH/CFA ± OT-II Th1 transfer. Three independent experiments; three to four mice/group per experiment.
(C and D) Number (C) and BFP-CXCL10 and RFP-CXCL9 MFI (D) within each immune subset. Three independent experiments; three to four mice/group per experiment.
(E) Frequency of BFP-CXCL10 and RFP-CXCL9 expression of day-5 OVA/CFA immunization ± OT-II Th1 or OT-II Th2 cell transfer of day 3 after immunization. Two independent experiments; three mice/group.
(F–H) IFNγ blockade, 0.5 mg XMG1.2 Ab (or control immunoglobulin G Ab [Ctl IgG]) administered i.p. 1 day before T cell transfer, followed by three daily injections of 1 mg. (F) Representative plots of BFP-CXCL10 and RFP-CXCL9 expression ± IFNγ blockade, day 5 OVA/CFA. (G) Frequency of chemokine expressing cells from (E). (H) Representative histograms of MHC-II expression on BFP-CXCL10+ cells from (E). (F–H) Three independent experiments; three to five mice/group.
(I) Number of CD4+ T cells and moDCs in the inflamed dermis following OVA/CFA immunization over time.
(J–N) CD4 depletion, 0.5 mg GK1.5 Ab (or Ctl IgG) administered i.p. 1 day before OVA/CFA immunization and day 1 and day 3 after immunization. (J) Frequency of RFP-CXCL9+ BFP-CXCL10+ within each of the immune subsets ± CD4 depletion. (K) Frequency of total BFP-CXCL10+ (left) and RFP-CXCL9+ BFP-CXCL10+ (right) cells, day 5 after immunization. Pooled data from two independent experiment; three to four mice/experiment. (L) Representative dermal tiled images of eight imaging fields of 512 (x) × 512 (y) × 60 (z) μm from control (left) and CD4 depleted (right) day-5 OVA/CFA mice, by IV-MPM; scale bar, 200 μm. Bottom, semi-automated 3D cluster reconstruction using DBSCAN-based algorithm. (M) Number of identified clusters per square millimeter of day-5 OVA/CFA-immunized dermis ± CD4 depletion. (N) Frequency distribution of BFP-CXCL10+ cell distance from Ag depot ± CD4 depletion. Three independent experiments, six mice, >15 imaging volumes per condition. Bars represent means ± SEM.
Statistics by two-way ANOVA with Sidak’s multiple comparisons (B–E, G, J, and K) or Mann-Whitney (M and N), *p ≤ 0.05, **p ≤ 0.01, ***p ≤ 0.001, ****p ≤ 0.0001.

