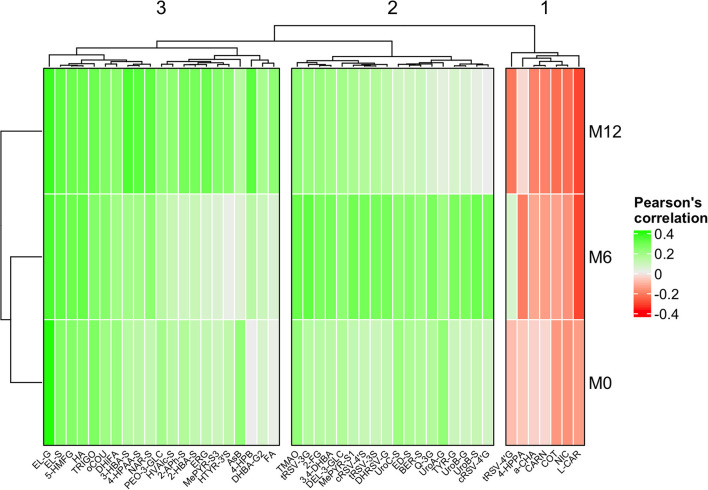
Figure 1.
Clustered heatmap showing Pearson's correlation across the three study points between the AHEI-2010 and those metabolites selected by LASSO or limma approaches, respectively. Cluster 1 shows those metabolites that tend to be negatively associated with AHEI-2010 at the three study time points. Clusters 2 and 3 show those metabolites positively associated with AHEI-2010 at each of the three study time points, making a slight distinction between those most strongly associated at time M6 (Cluster 2), and times M0 and M12 (Cluster 3).

