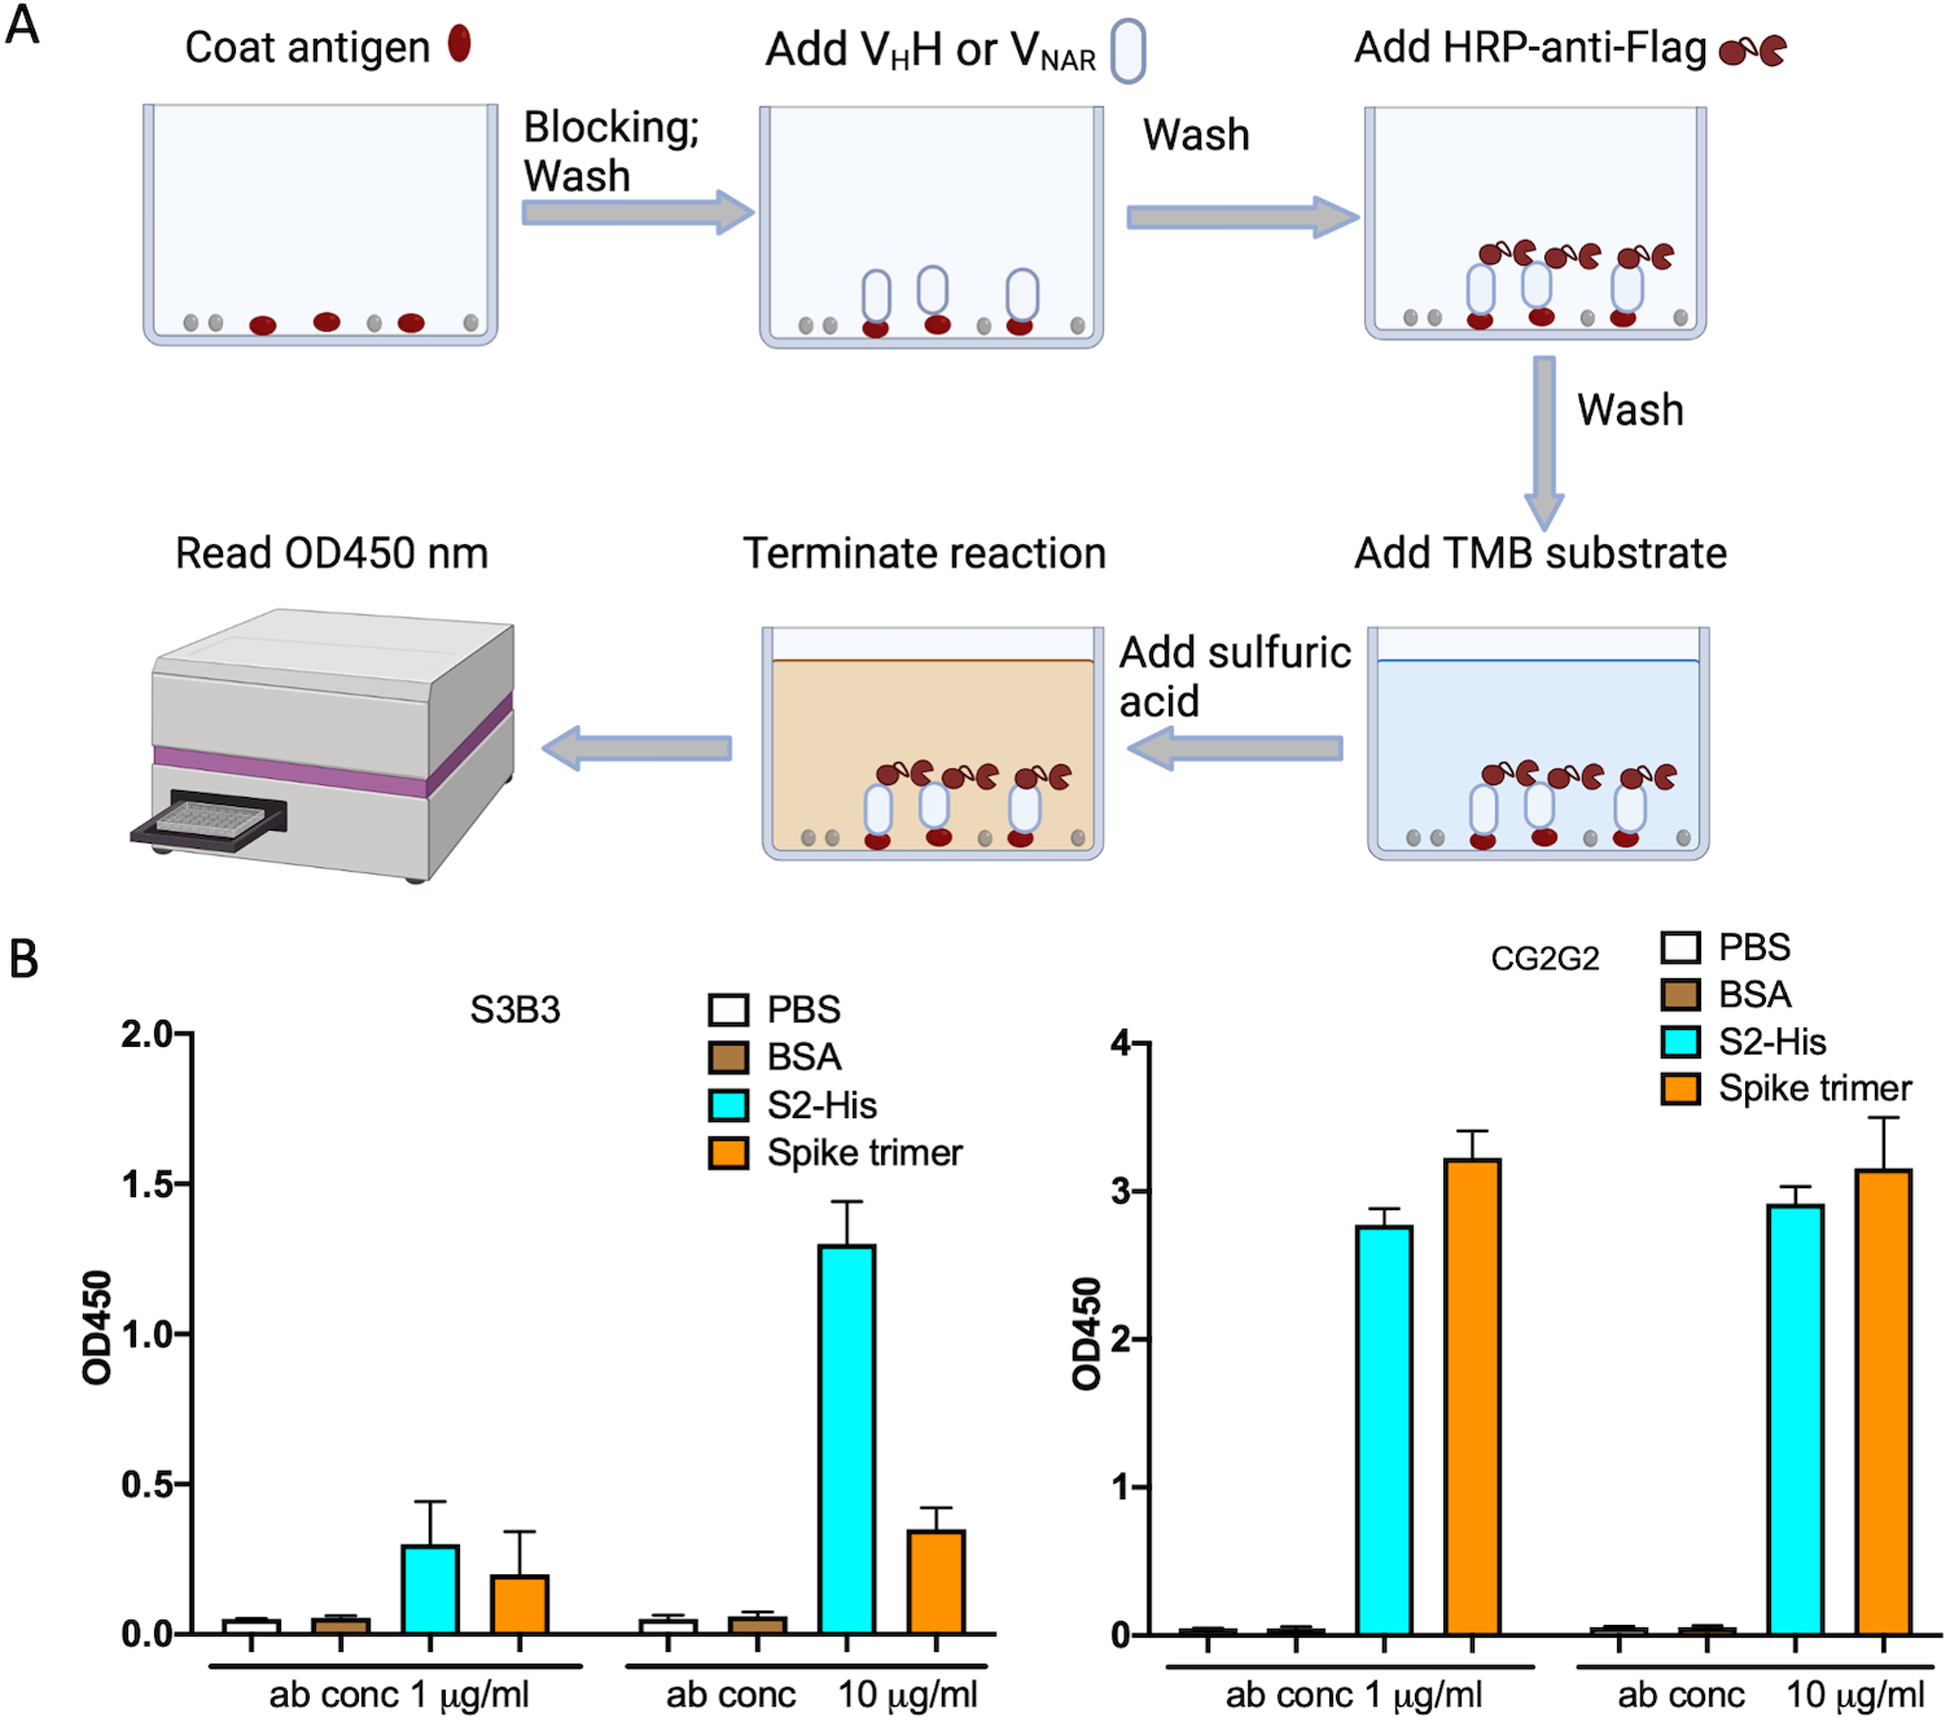
Figure 6.

ELISA testing of S3B3 and CG2G2 binding to S2 subunit and spike trimer of SARS-CoV-2. A) The diagram of the ELISA. B) The antigens (5 μg/ml in PBS) were coated on ELISA plate and two concentrations of S3B3 and CG2G2 were used to test the binding. The signal was read on the plate reader at the OD450 nm. The graph was made by GraphPad Prism.
