
Figure 2.
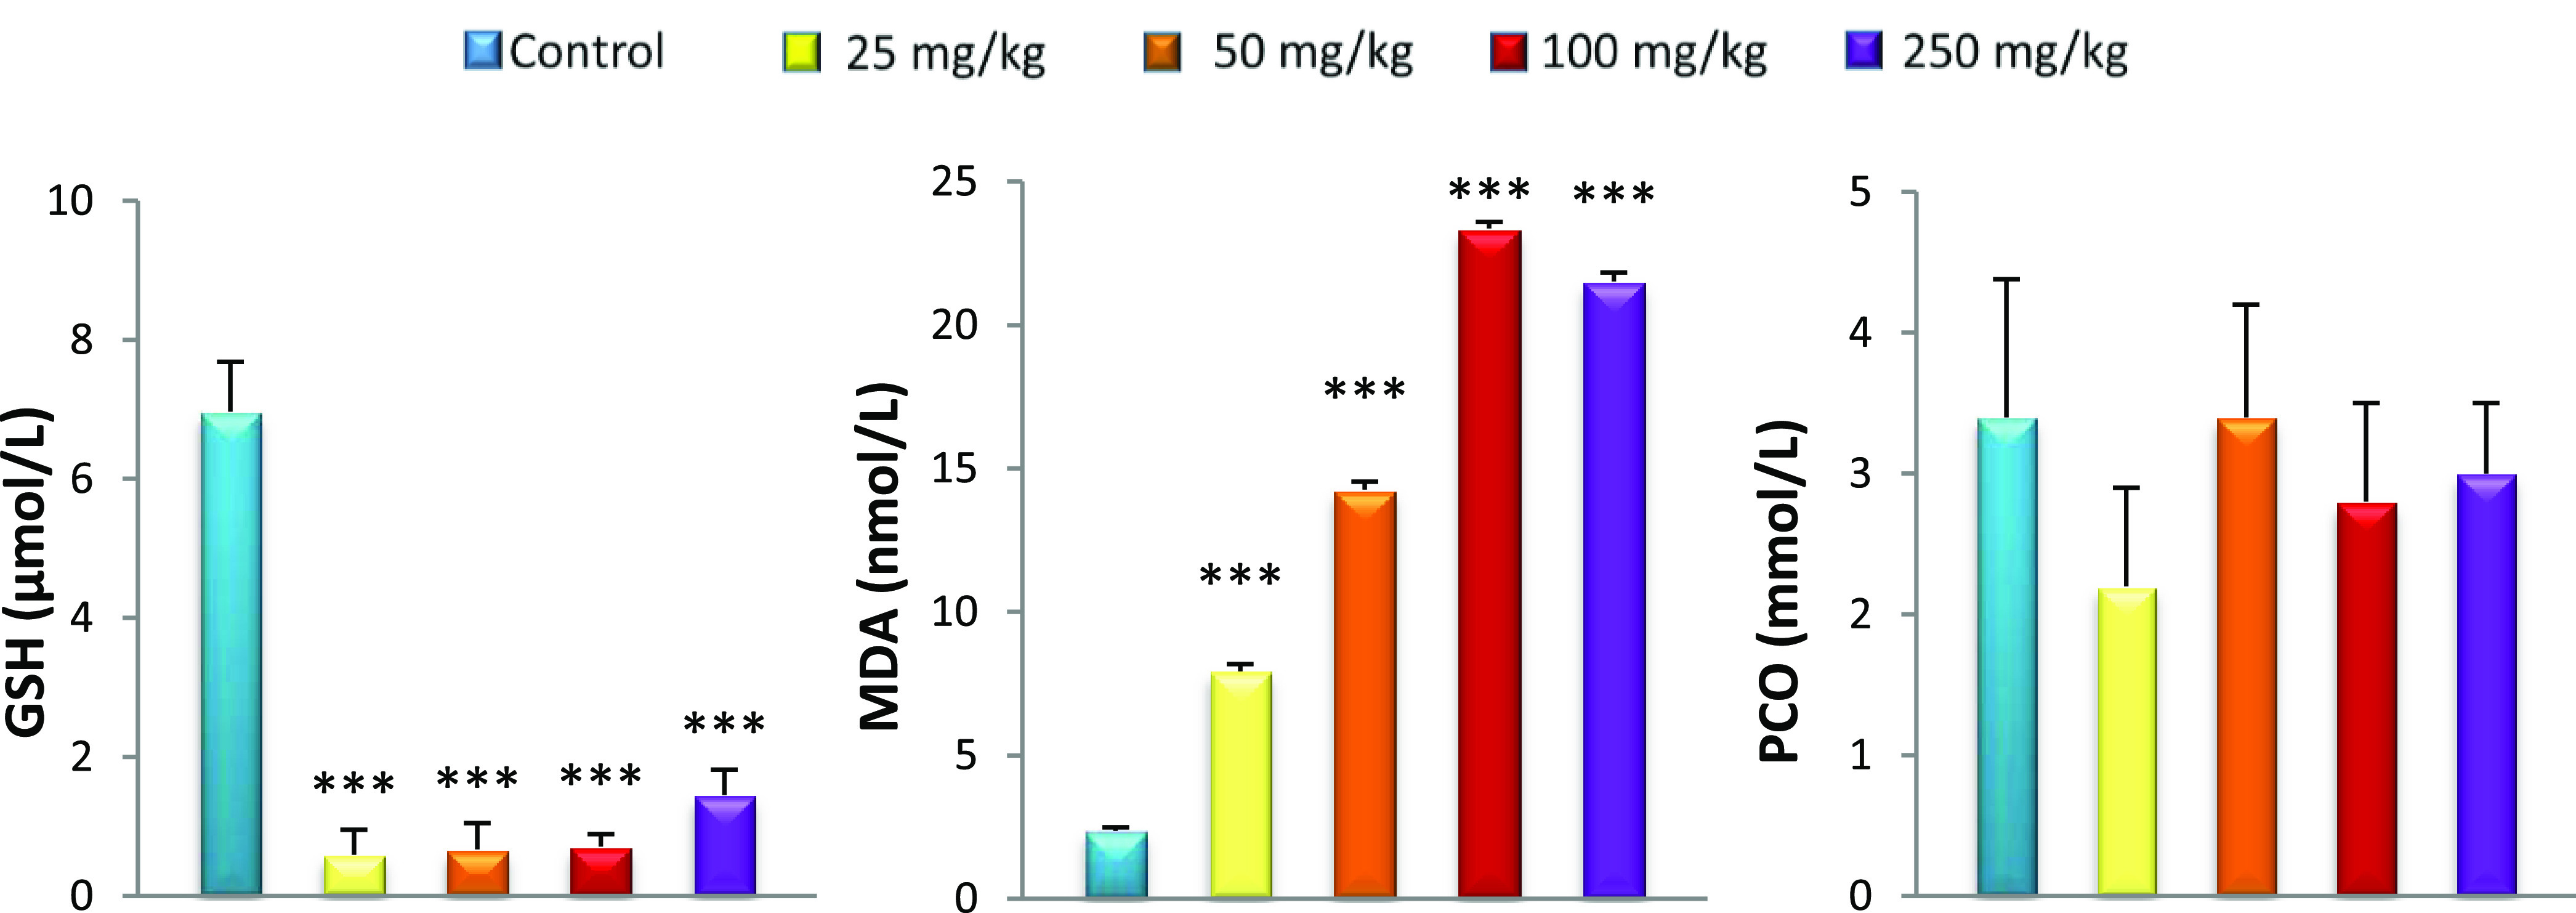
Effect of caudal injection of different doses of GNPs on plasma GSH, MDA, and PCO levels compared to control. Values were presented as mean ± SD. ***P < 0.001.
Official websites use .gov
A
.gov website belongs to an official
government organization in the United States.
Secure .gov websites use HTTPS
A lock (
) or https:// means you've safely
connected to the .gov website. Share sensitive
information only on official, secure websites.
Effect of caudal injection of different doses of GNPs on plasma GSH, MDA, and PCO levels compared to control. Values were presented as mean ± SD. ***P < 0.001.