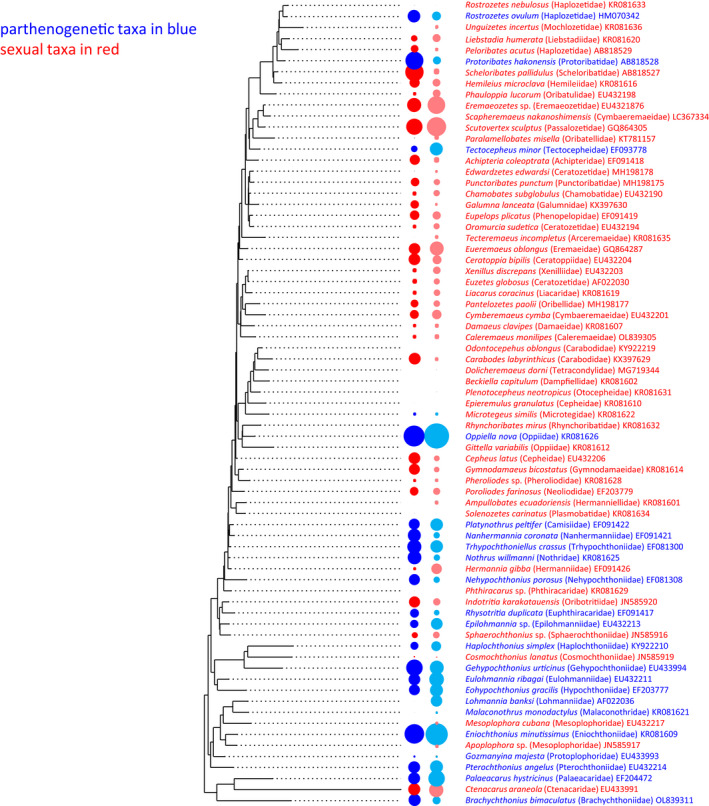
FIGURE 2.

Maximum likelihood tree used in this study to test for phylogenetic constraints in geographic range sizes. Parthenogenetic species are indicated in blue, sexual species in red. The dark blue circles (left column) indicate the range size of the parthenogenetic species; the light blue circles (right column) indicate the mean range size of the parthenogenetic families; the dark red circles (left column) indicate the range size of the sexual species; the light red circles (right column) indicate the mean range size of the sexual families (very small range sizes are not visible)
