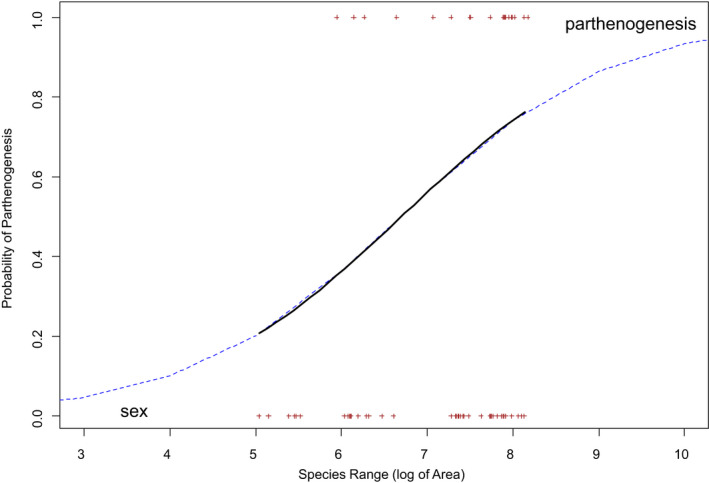
FIGURE 3.

Prediction of the phylogenetic generalized binomial (and linear) model for the relationship between the geographic range size of species and parthenogenetic reproduction (binary data; yes (1) or no (0)). Range size of species showed no phylogenetic signal while reproductive mode did (see text for details). Each point (cross) corresponds to a species. The solid, black line shows the range sizes of the actual data and the dashed line the extrapolation of the model beyond the observed range size of species
