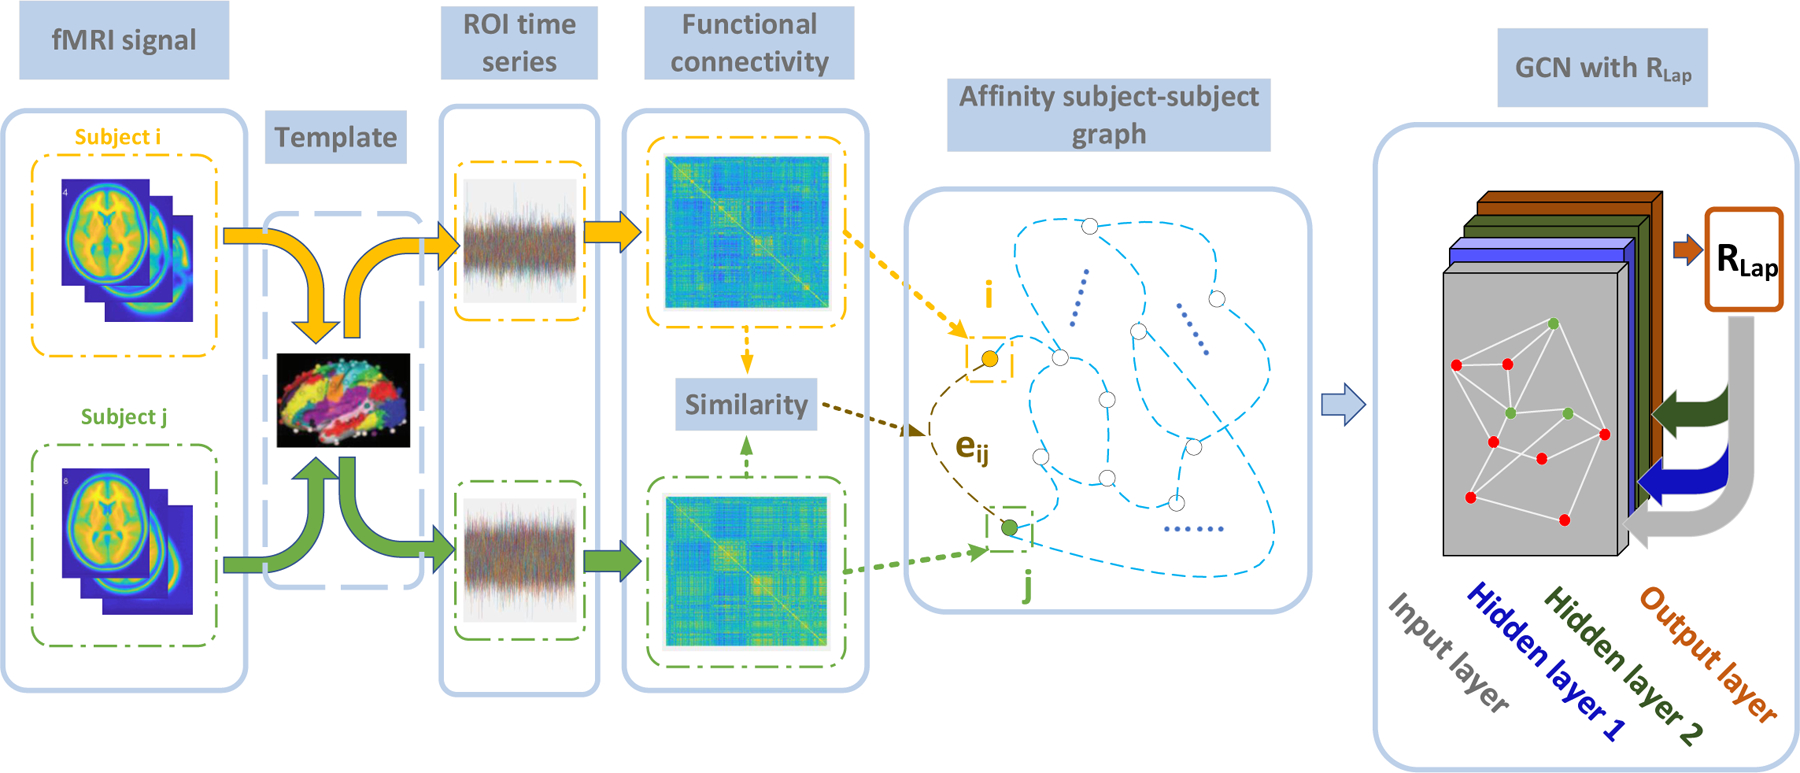
Fig. 1.

The flowchart of this study. First, the fMRI for each subject is mapped to the ROI time series using the Power brain template [23], followed by FC calculation via Pearson correlation. The affinity subject-subject graph is then built by measuring the similarity between FCs as edges, e.g., eij between node i and node j. Next, the GCN is applied for the classification of different cognitive functions. In this step, the graph is sparsified by K-nearest neighbors, and partially labeled (e.g., nodes with labels are marked in green, while nodes without labels are marked in red) for semi-supervised learning. The Laplacian regularization term RLap is enforced at the output layer, and the model parameters are estimated via back-propagation.
