
Fig. 5.
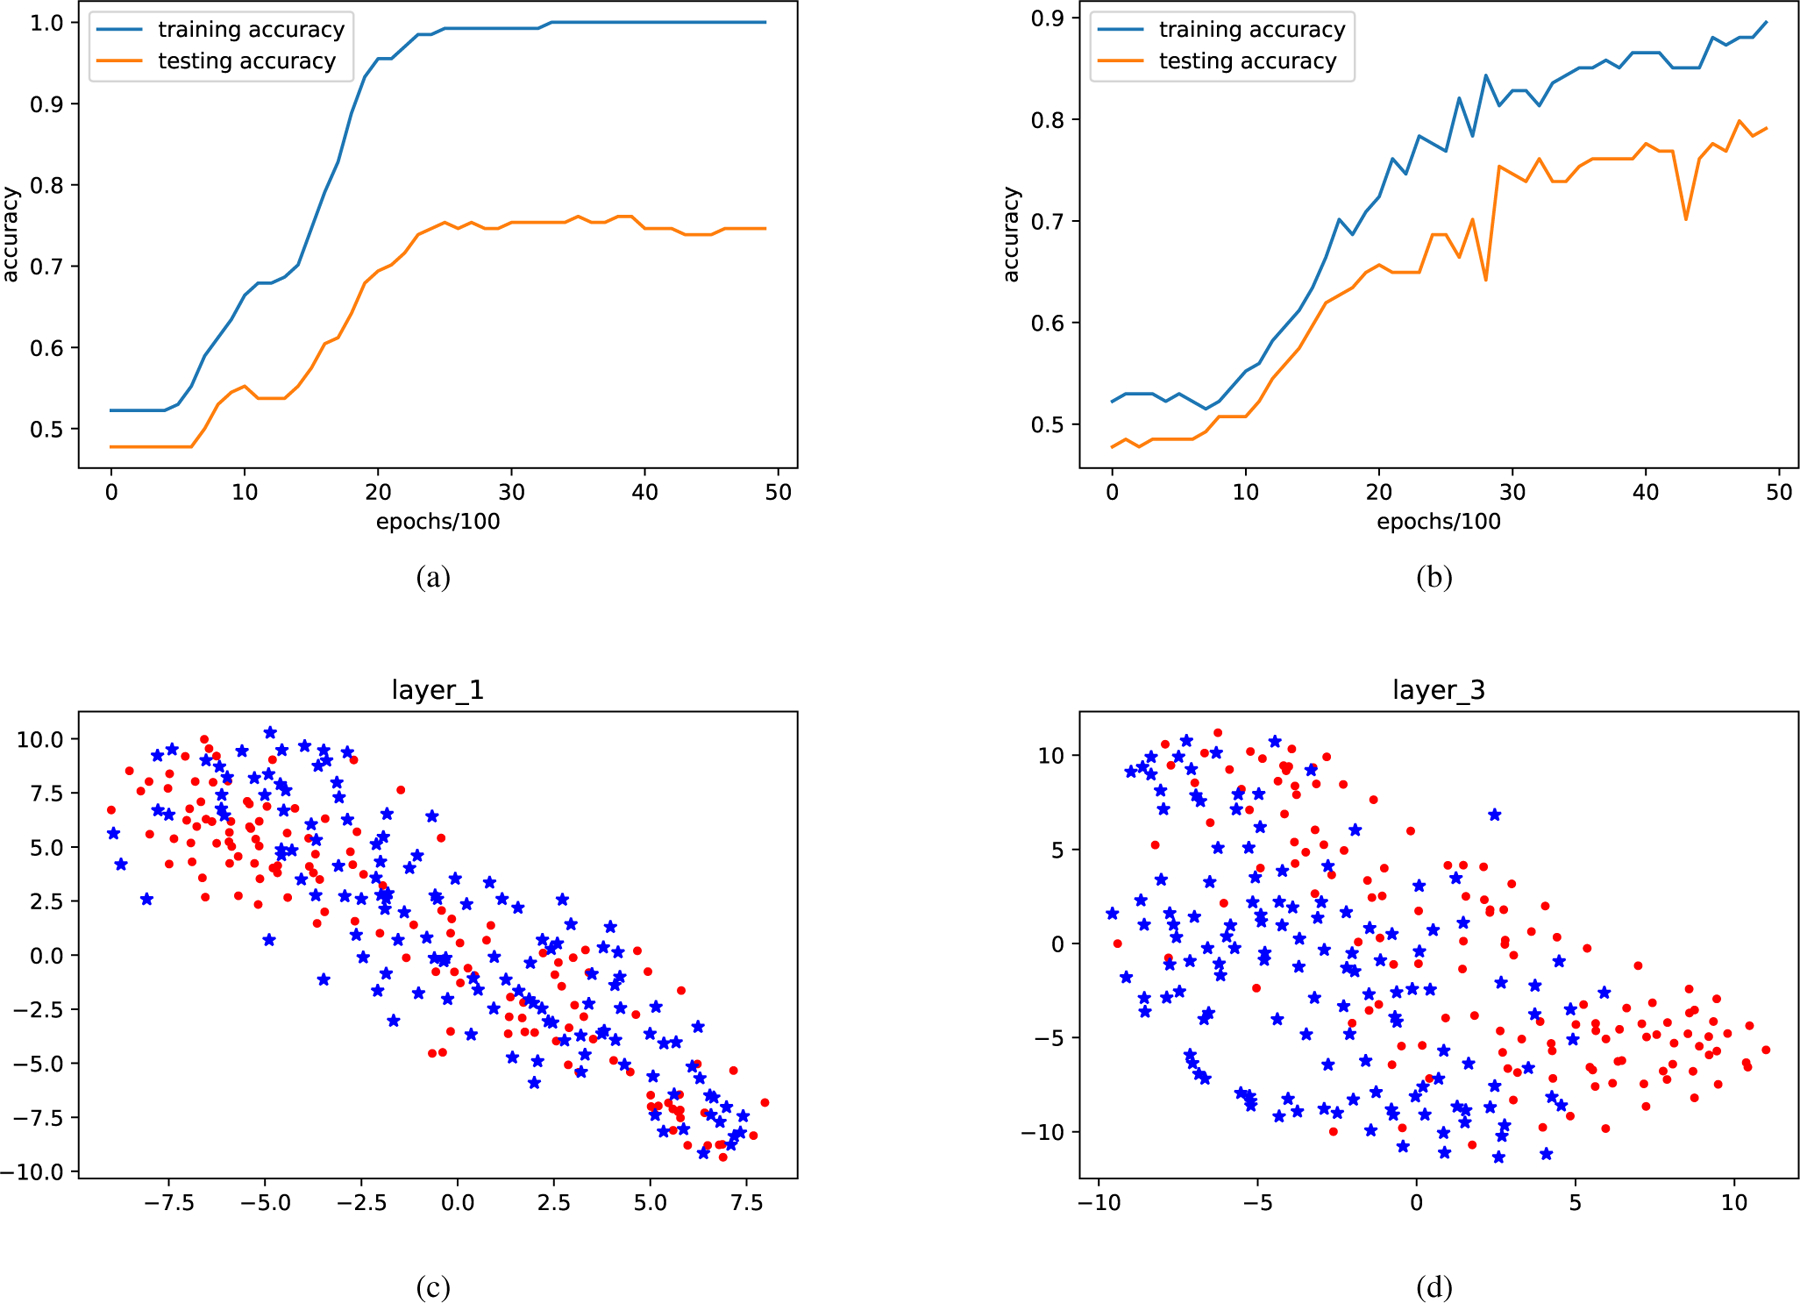
(a) An example of the overfitting, where a large gap (around 27%) can be observed between training and testing accuracy. (b) Both the training and testing accuracy after the Laplacian regularization term is applied. The overfitting problem is thus alleviated. Figures (c) (d) are the visualization of GCN trained on rest-fMRI, in which red dots represent subjects with high WRAT scores, and blue asterisks represent subjects with low WRAT scores. From the first layer to the third layer of GCN, two groups are observed to be clustered more discriminatively.