
Fig. 8.
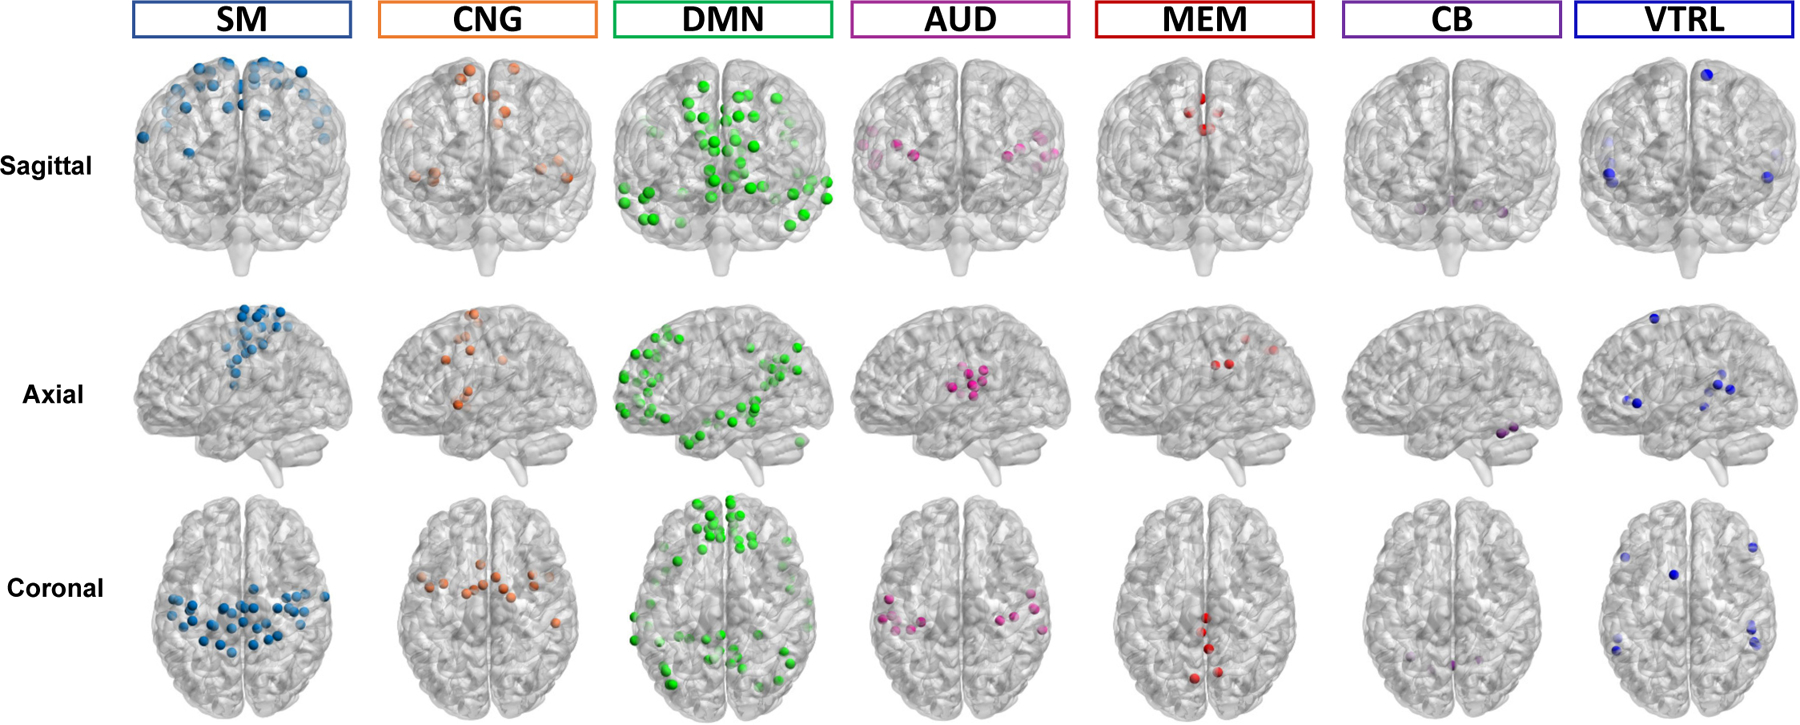
The brain functional networks identified with ROI-level average OS in sagittal, axial, and coronal views, respectively, including SM, CNG, DMN, AUD, MEM, VTRL, and CB. Dots with different colors represent ROIs in different brain functional networks.