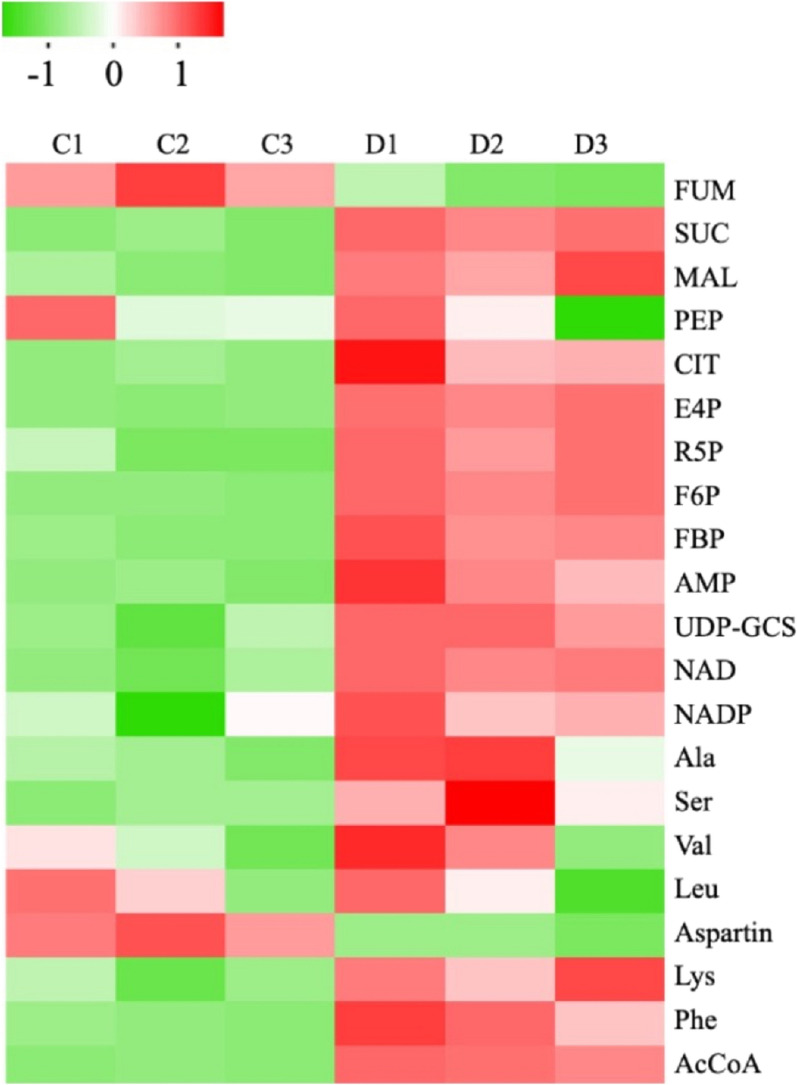
Fig. 5.
Target metabolomics analysis of Synechococcus cscB+ under coculture and axenic culture conditions. Heatmaps of metabolomics profiles in Synechococcus cscB+ under coculture and axenic culture conditions. The cells grown at 48 h under coculture (D) and axenic culture conditions (C) were harvested and then subjected to analysis. D1, D2 and D3 represent three repeated samples for coculture conditions, and C1, C2 and C3 represent three repeated samples for axenic culture conditions. The colour in the heatmap indicates the log2 transformed ratio of a given metabolite versus the average concentration of the metabolites in all samples

