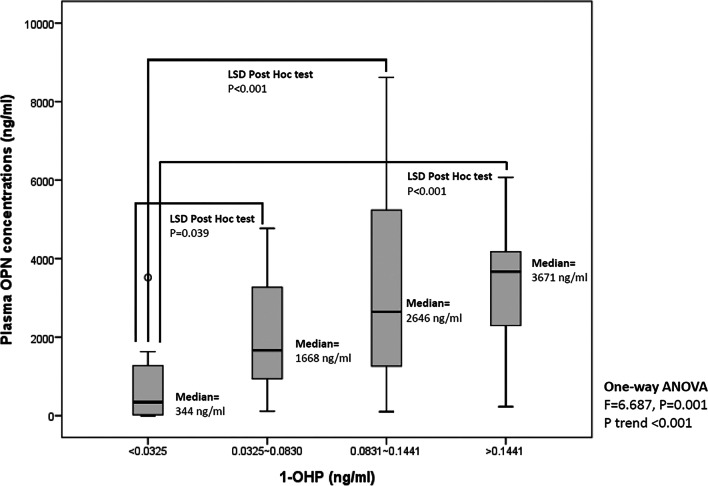
Fig. 7.
Plasma OPN concentrations were correlated with urinary 1-OHP concentration in a human population. Fasting blood samples and urine samples were collected from nonsmoking young adults for analysis. The plot shows plasma OPN concentrations across quartiles of urinary 1-OHP levels. One-way ANOVA and P trend analysis were used to assess the differences and trends in OPN levels. Fisher’s least significance difference (LSD) method was used in post hoc comparisons to test the difference in OPN levels for a two-by-two comparison with the 1-OHP groups

