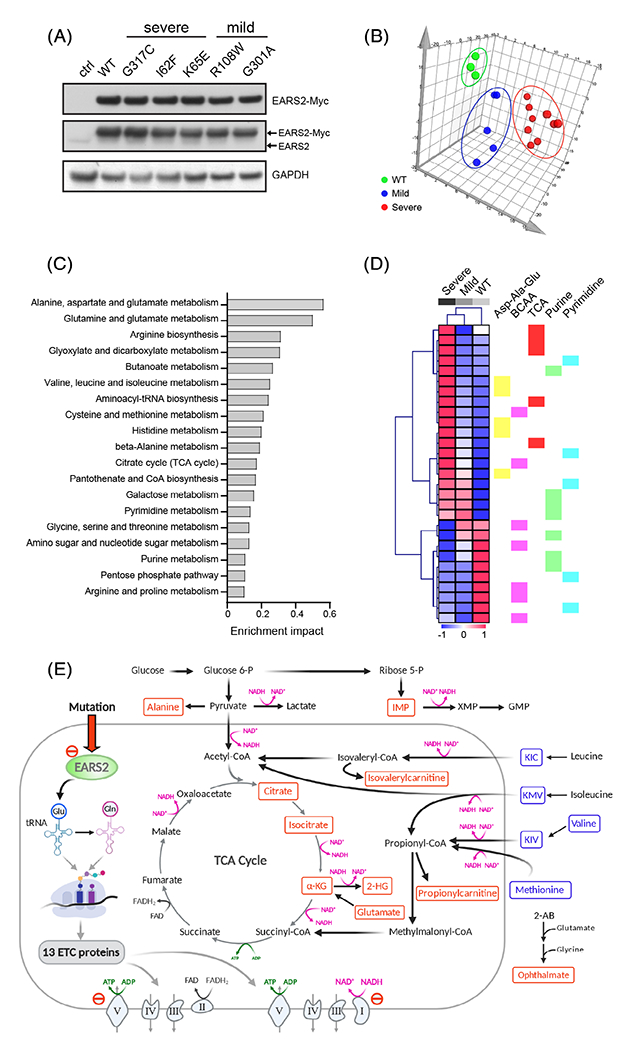
FIGURE 4.

Metabolomic analysis of EARS2 variants associated with differential disease severity. A, Immunoblot analysis of P3-041 fibroblasts with ectopic expression of the indicated EARS2 variants. The upper blot was probed with an anti-MYC antibody, and the middle blot was probed with an anti-EARS2 antibody. B, Principal component analysis of the P3-041 fibroblast lines with ectopic expression of WT (green) EARS2 or EARS2 variants associated with mild (blue) or severe (red) COXPD12. C, Pathway analysis of the metabolites associated with expression of variants from severe COXPD12 in P3-041 fibroblasts. The metabolites significantly associated with disease severity were defined by correlation analysis (coefficient cutoff 4) and one-way ANOVA test (f value ≥1), followed by MetaboAnalyst pathway analysis. D, Heatmap displaying changes in metabolite abundance upon expression of WT EARS2 or EARS2 variants associated with mild or severe COXPD12 in P3-041 fibroblasts. Metabolites whose abundance correlated with disease severity and belonging to the KEGG pathways indicated in (C) are displayed in the heat map. The color scale corresponds to z-score values. E, Metabolic alterations in fibroblasts expressing EARS2 variants. The scheme emphasizes pathways related to the perturbations in the TCA cycle and amino acid catabolism. Red metabolites are elevated and blue metabolites are depleted in cells expressing EARS2 variants from severe COXPD12
