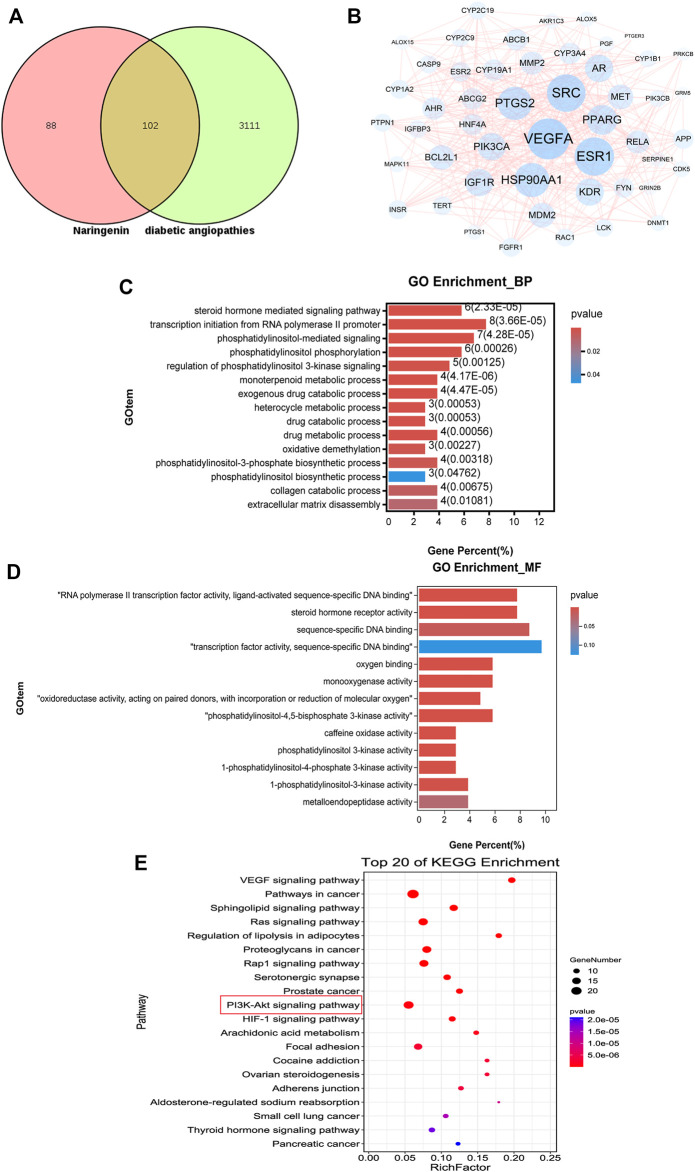
FIGURE 6.
Results of network pharmacology analysis. (A) Venn diagram shows the number of common targets between Nar and diabetic angiopathies. (B) Protein–protein interaction (PPI) network of the common targets according to degree value analyzed by Cytoscape software. (C) GO enrichment (BP) analysis of network pharmacology. (D) GO enrichment (MF) analysis of network pharmacology. (E) Top 20 most enriched KEGG categories for the common targets shows the vital Nar-related signaling pathway against diabetic angiopathies according to network pharmacology analysis.

