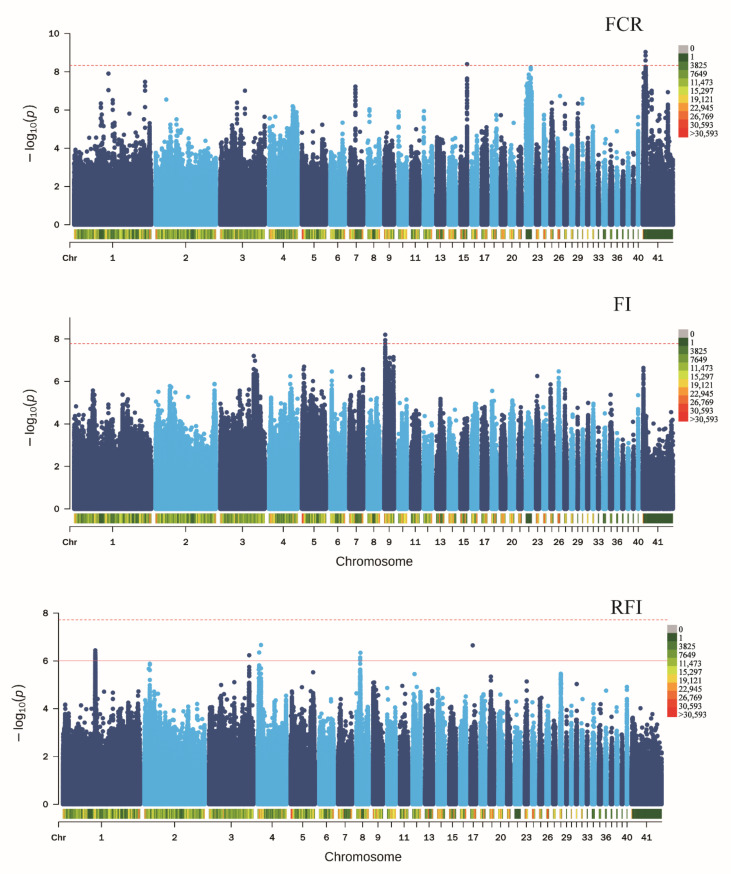
Figure 3.
Genome-wide association study of the three FE traits in ducks. Manhattan plots in which the genomic coordinates of the SNPs are displayed along the horizontal axis, the negative logarithm of the association p-value for each SNP is displayed on the vertical axis. The red line indicates the significance threshold level after Bonferroni correction.

