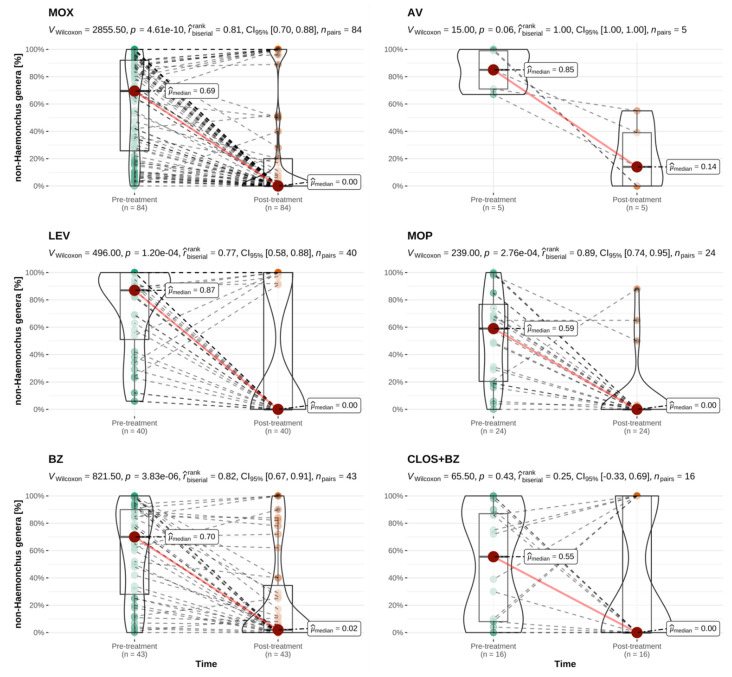
Figure 4.
Paired comparison of the pre- and post-treatment percentage of non-Haemonchus strongyle eggs for treatments performed in sheep, by anthelmintic category. This analysis included all ovine treatments irrespective of their classification as successful or unsuccessful. MOX = moxidectin; AV = avermectins, LEV = levamisole; MOP = monepantel; BZ = benzimidazoles; CLOS + BZ = closantel and mebendazole; n = number of flocks treated per category with available paired results. rrankbiserial = effect size with CI95% = 95% confidence interval; npairs = number of paired results. Interpretation of rrankbiserial: <0.05: tiny; ≥0.05 and <0.1: very small; ≥0.1 and <0.2: small; ≥0.2 and <0.3: medium; ≥0.3 and <0.4: large; ≥0.4: very large [45]. Explanation of scientific notation for p-values: 4.61e-10, 1.20e-04, 2.76e-04 and 3.83e-06 are all equivalent to p < 0.001.

