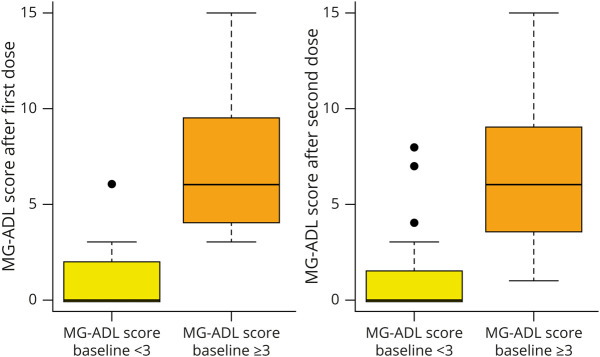
Figure 2. MG-ADL Score After Vaccination in Accordance With Baseline MG-ADL Score.
Boxplot representing the MG-ADL scores after the first and second doses. The vertical axis represents the MG-ADL score reported by the patients, from minimum to maximum. The horizontal axis represents the MG-ADL score at baseline less than 3 (yellow box) or equal to or greater than 3 (orange box). At both time points, patients with an MG-ADL at baseline of 3 points or more had a higher MG-ADL score after each dose, with higher ranges reflecting greater variability in that group. MG-ADL score = myasthenia gravis activities of daily living score.

