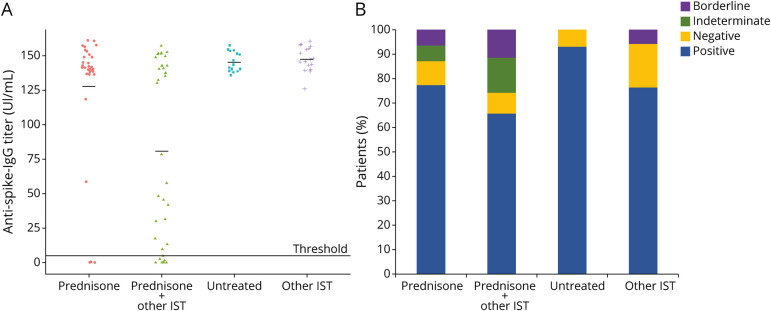
Figure 3. Antispike-IgG Antibody titers and IGRA Positivity After Vaccinations According to Treatment Group.
(A) Antispike-IgG antibody titers in IU/mL is represented in the dot plot for each treatment group. The mean titer is represented by a black line for each group. Threshold line represents the 5 IU/mL cutoff for positivity. (B) Blue bars indicate the percentage of IGRA-positive patients. The percentage of IGRA-negative patients is indicated in yellow bars. Indeterminate IGRA are represented in green bars. IGRA resulting in borderline tests are represented in purple bars. IgG = immunoglobulin G; IGRA = interferon gamma release assay; IST = immunosuppressant therapy.

