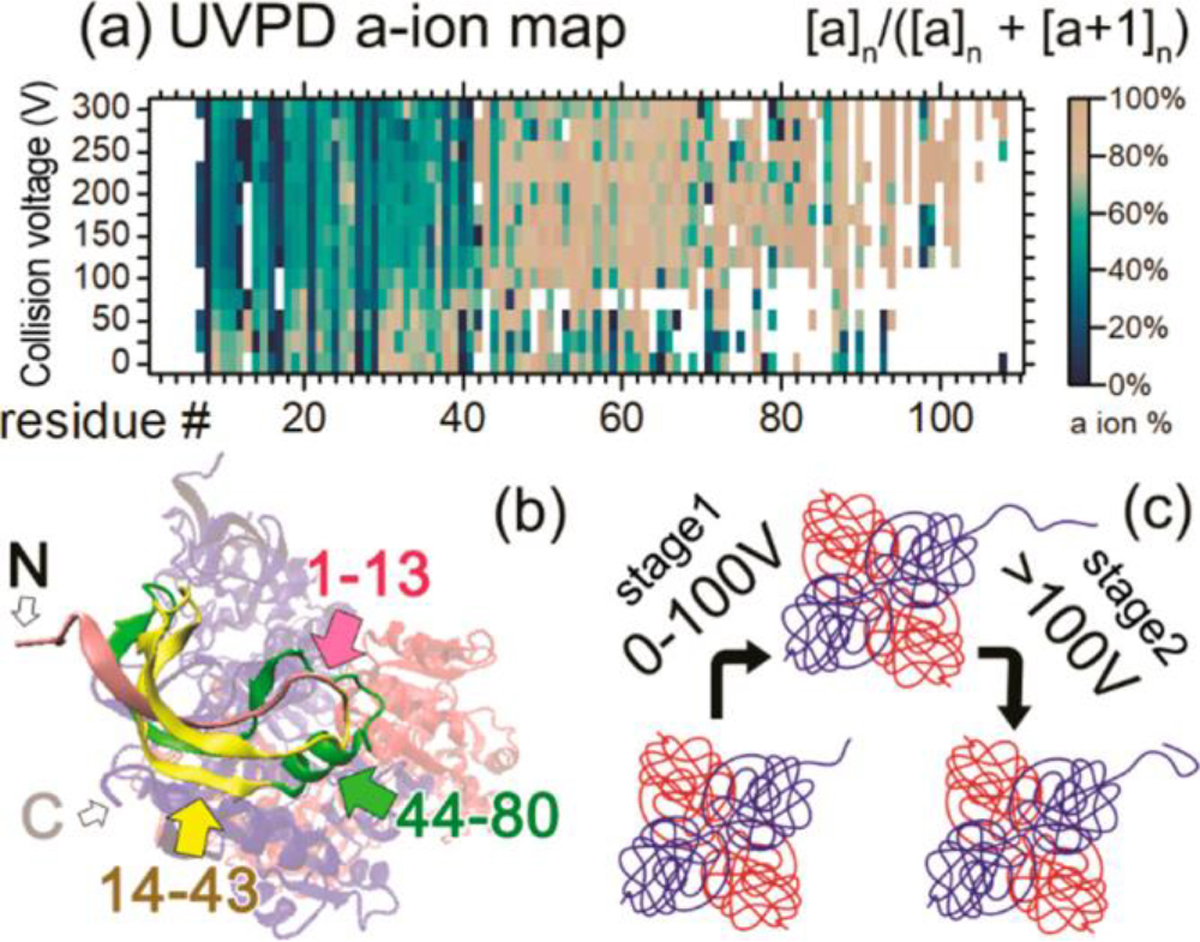
Figure 2.

(a) a-ion percentage map for ADH 4mer. Horizontal axis shows the residue number from 1 to 120. Vertical axis shows increasing in-source collision voltage. Color scales are at the right side of the map. (b) Crystal structure of the ADH 4mer. Residues 1–13 of one 1mer subunit are in pink, 14–43 are in yellow, and 44–90 are in green. N/C-termini of the 1mer are noted with “N” and “C”. (c) Proposed ADH unfolding and refolding mechanism based on the native TD data. Reproduced with permission from ref46 https://pubs.acs.org/doi/abs/10.1021/acs.analchem.9b03469. Copyright 2019 American Chemical Society. Further permissions related to the material excerpted should be directed to the ACS.
