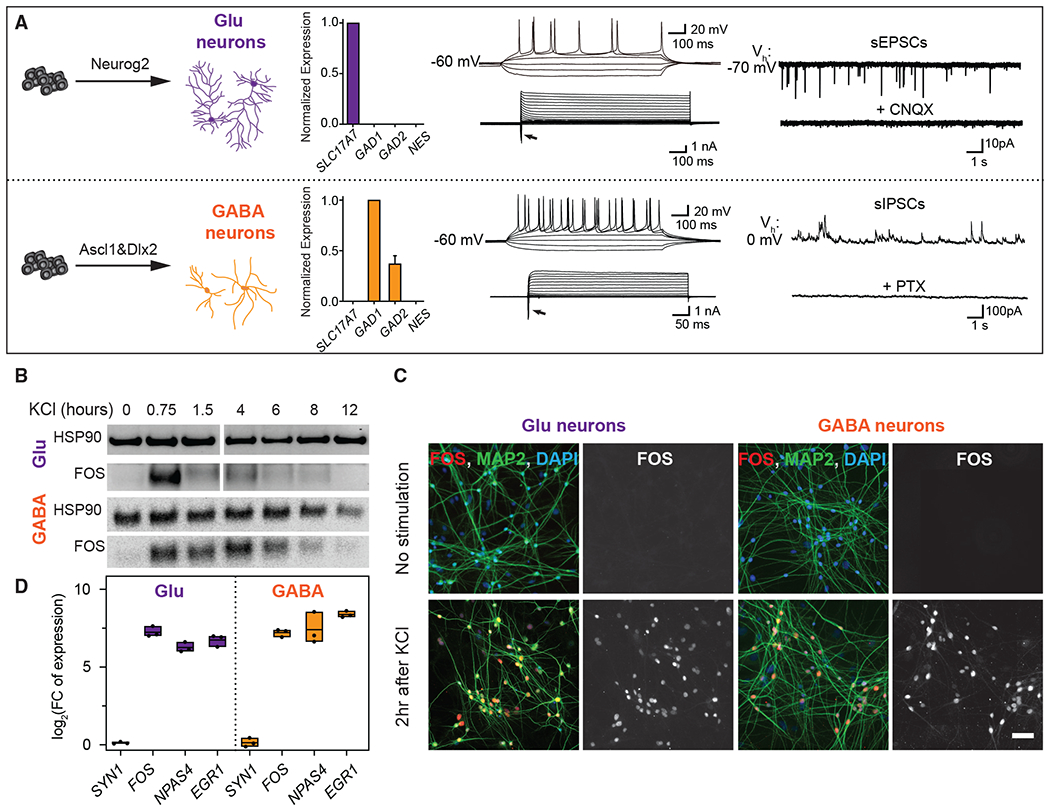
Figure 1. Activation of gene expression.

(A) Generation and functional characterization of human neurons. Neurog2 or Ascl1/Dlx2 are delivered to PSCs to generate Glu and GABA neurons. Quantification of selected mRNA levels in neurons after 5 weeks with glia coculture confirmed the neuronal subtype identity. Data are represented as means ± SEMs, n = 3 replicates. Neurons fired repetitive action potentials when depolarized. Whole-cell current response with step current injections was recorded in both neuronal subtypes. sEPSCs were recorded at a holding potential of −70 mV in Glu neurons and blocked by CNQX (20 μM). sIPSCs were detected at a holding potential of 0 mV in GABA neurons and blocked by picrotoxin (50 μM).
(B–D) Expression of activity-responsive genes.
(B) Immunoblot analyses showed FOS activation kinetics. HSP90 was used as the loading control. The marker lane between 1.5 and 4 h was removed.
(C) Neurons immunolabeled for FOS (red) and the pan-neuronal marker MAP2 (green). Images are representative of >20 independent experiments. Scale bar, 50 μm.
(D) Fold induction of mRNA of selected genes at 45 min after KCl measured by qRT-PCR. Data are represented as log2 fold change (n = 3, mean and minimum to the maximum range).
See also Figure S1.
