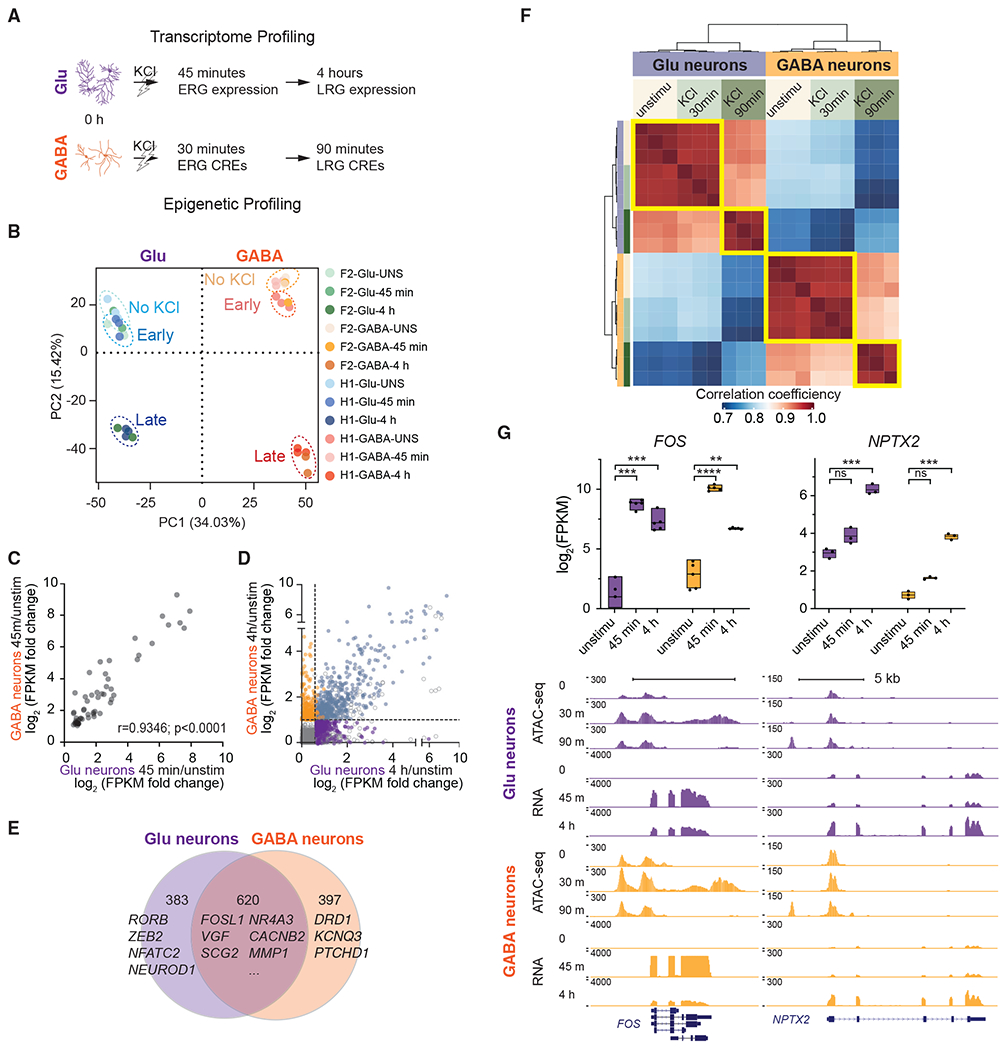
Figure 2. Activity-regulated gene transcription and chromatin accessibility.

(A) Workflow.
(B) PCA of gene expression data (top 2,000 high-variance genes) from Glu and GABA neurons.
(C) Correlation of expression fold change (log2) values of shared ERGs. Dots represent the mean values of 5 biological replicates. Pearson’s r= 0.9346, p < 0.0001.
(D) Correlation of expression fold change (log2) values of late response genes (LRGs).
(E) Venn diagram displaying the number of genes induced after KCl specifically in Glu (purple), GABA neurons (orange), or commonly in both types (overlapping).
(F) Correlation plot shows the relationship of open chromatin regions among cell types and activity states. Sample-to-sample distance matrix with hierarchical clustering was calculated using the ATAC-seq peak signals.
(G) Expression values measured by RNA-seq of known cell-type-specific or activity-induced genes before or after stimulation. (Upper panel, n = 5; box, minima and maxima, box center = mean; 2-tailed Student’s t test, *p < 0.05 compared with unstimulated (unstimu), ns, not significant.) University of California, Santa Cruz (UCSC) Genome browser tracks for the FOS and NPTX2 loci, indicating chromatin accessibility (ATAC-seq) and gene expression (RNA-seq) in response to KCl.
See also Figures S2 and S3 and Table S1.
