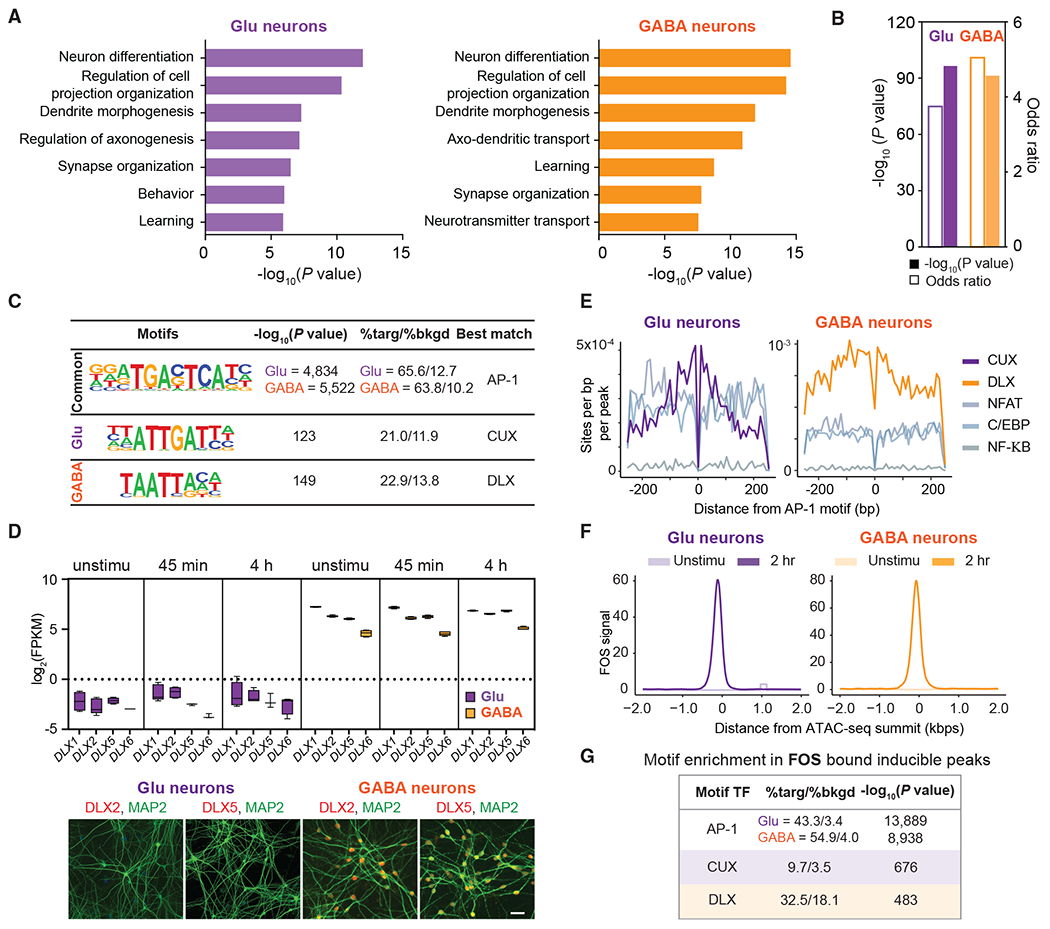
Figure 4. AP-1 TFs collaborate with neuronal TFs to select LRG enhancers.

(A) Top-ranked Gene Ontology terms enriched in cell-type-specific enhancers with GREAT analysis; complete list in Table S7.
(B) LRG enhancers in Glu and GABA neurons are enriched for LRGs.
(C) Motif enrichment within late-inducible ATAC-seq peaks.
(D) Expression of DLX family genes. DLX2 and DLX5 proteins are detected in GABA neurons but not Glu neurons. Box center, median; box, 25th to 75th percentiles; whiskers, minima and maxima. Scale bar, 50 μm.
(E) Motif histogram plots of Glu (left) and GABA (right) neuron late-inducible CREs centered over AP-1 binding motif.
(F) Read density aggregate plots of FOS-bound peaks centered over ATAC-seq summits before and after stimulation.
(G) Position weight matrices of top motifs enriched in FOS-bound inducible peaks in Glu (purple) and GABA (orange) neurons. The ratios indicate the proportion of peaks containing respective motifs compared to a guanine-cytosine-matched background set of genomic regions.
