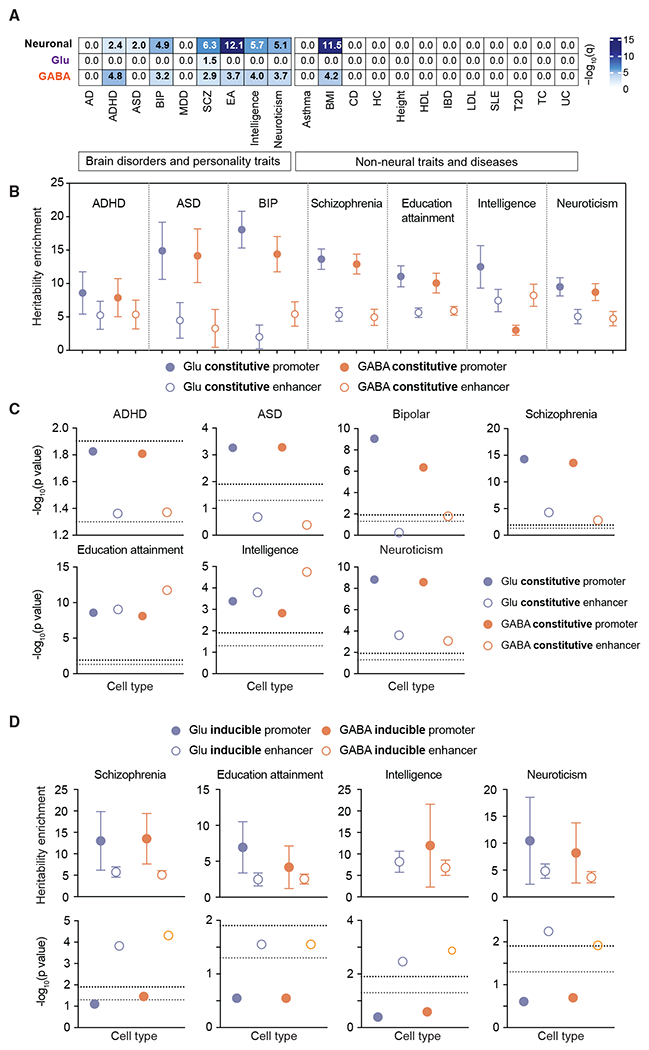
Figure 5. Disease heritability enrichment in CREs.

(A) Heatmap of LDSC analysis for genetic variants associated with brain disorders and behavior traits displayed as −log10(q) value for significance of enrichment for shared or cell-type-specific ATAC-seq peak regions in Glu and GABA neurons. Bold text indicates q < 0.05. The top 21,989 peaks from Glu, GABA, and shared neuron datasets were used for the analysis.
(B and C) Heritability enrichment of constitutive promoter regions and enhancer regions across neuropsychiatric disorders and behavioral traits. The black dashed lines in (C) show the cutoff for multi-test corrected p < 0.05. The gray dashed lines in (C) show the cutoff for p < 0.05.
(D) Heritability enrichment of the inducible promoter and enhancer. The black dashed lines show the cutoff for multi-test corrected p < 0.05. The gray dashed lines show the cutoff for p < 0.05. Each heritability enrichment value is provided in the scatterplot (±SE).
