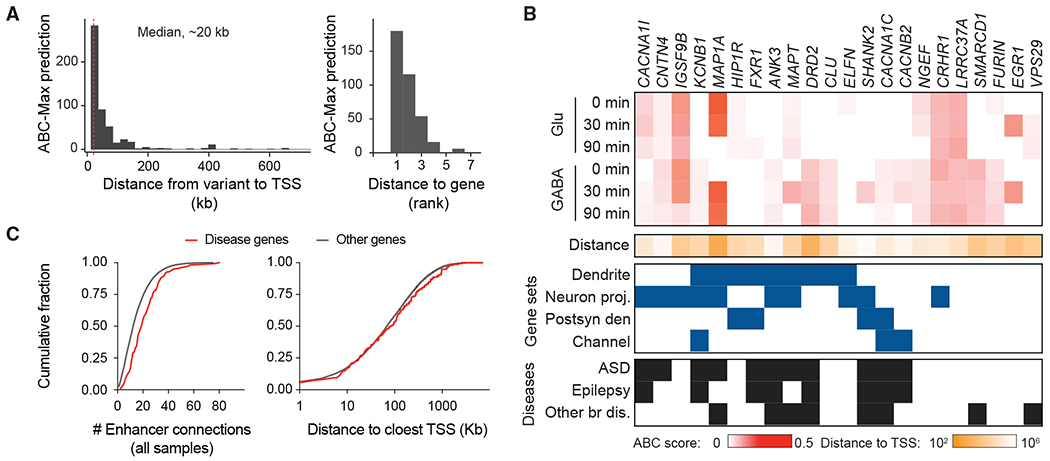
Figure 6. Connecting GWAS variants to target genes.

(A) Histogram showing the distances from the disease variants to the TSS of the ABC-Max gene (left) and the distance rank of the gene in the locus (right). Data include predictions for ASD, ADHD, bipolar disorder, and SCZ.
(B) ABC analysis connected variants to target genes. The heatmap shows the ABC scores in 6 samples (maximum value within each condition). Red scale: ABC score; tangerine scale: log10-transformed genomic distance from variant to gene TSS. The ABC genes were enriched for genes that function at the dendrites (adjusted p: 7 × 10⁻³) and neuron projection (adjusted p: 3.4 × 10⁻²) based on GO analysis. Blue boxes indicate the ABC disease gene encodes a product located in a specific cellular compartment, including “dendrite,” “neuron projection” (Neuron Proj.), “postsynaptic density” (Postsyn den), and “channel components.” Black boxes indicate that rare variants in the gene have been reported in individuals with ASD, epilepsy, or other brain diseases (Other br dis).
(C) The cumulative distribution plot shows the number of ABC enhancer-gene connections in all of the samples (left) and the distance to the closest TSS for genes linked to diseases and others.
