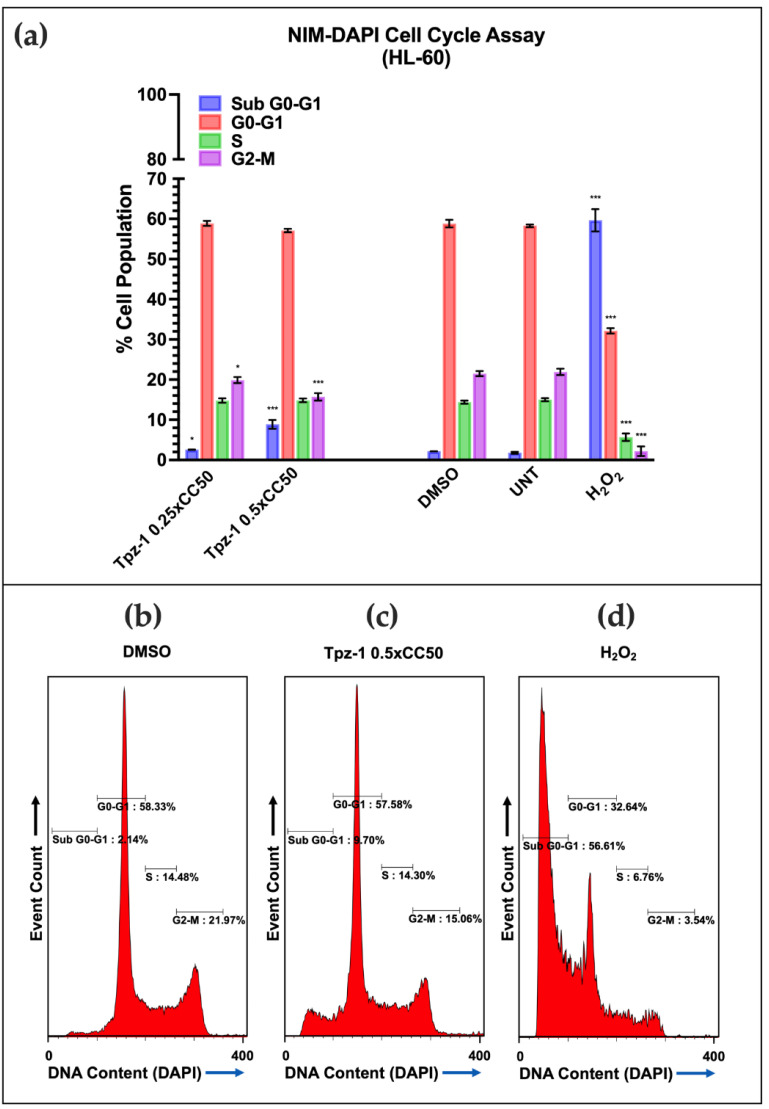
Figure 4.
(a) Tpz-1 cytotoxicity is G2-M phase-dependent in HL-60 cells after 72 h of exposure to the 24 h 0.25xCC50 (0.24 μM; Sub G0-G1 p = 0.047421; G2-M p = 0.046939) or 0.5xCC50 (0.48 μM; Sub G0-G1 p = 0.000484; G2-M p = 0.000873). NIM-DAPI was used to stain and quantify the DNA content of each sample. Tpz-1-treated cells displayed DNA fragmentation, denoted by an increase of cells in sub G0-G1, that was concurrent with a loss of cells in G2-M. 0.1% v/v DMSO and 100 µM H2O2 were utilized as vehicle and positive controls for cytotoxicity, respectively. Untreated (UNT) controls were also included. The percentages and standard deviations represent the average of three technical replicates. (b–d) Representative histograms for DMSO, 0.5xCC50 Tpz-1, and H2O2 treated samples. Statistical analysis was achieved by two-tailed Student’s paired t-test, and the asterisk annotations in each graph represent the statistical significance of the treatments against the vehicle control; (*) p < 0.05, (***) p < 0.001.

