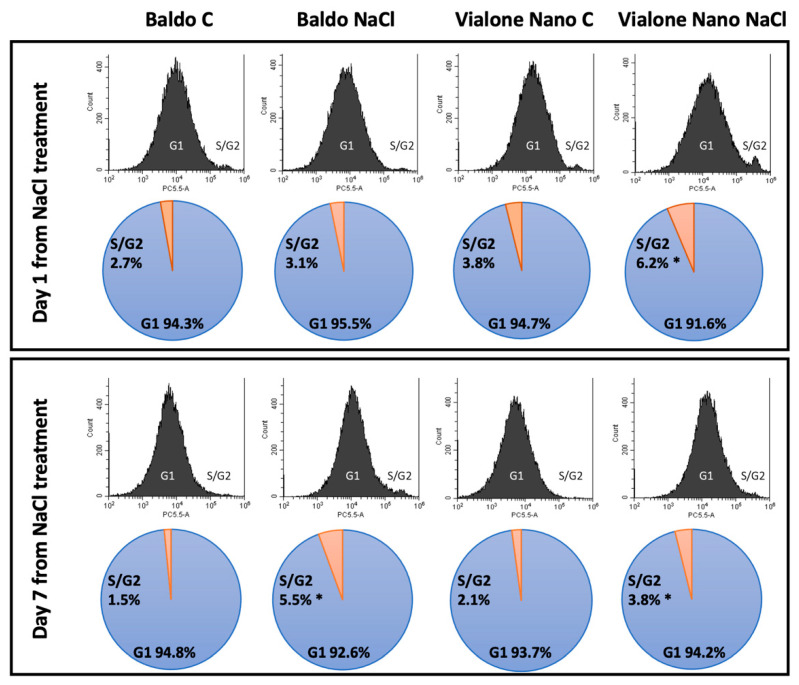
Figure 3.
Cell cycle regulation in rice roots subjected to salt stress. Flow cytometric analysis of cell cycle of Baldo and Vialone Nano roots in control and salt stress conditions at 1 day and 7 days after salt treatment. All samples were stained with PI. Cell cycle progression in apical root meristem in response to salinity treatment. The analysis reflects the relative number of cells according to DNA content in each cell. The first peak (2n) represents the G1-phase and the second peak (4n) represents the S/G2 phase. Corresponding diagrams report the proportion of cells in G1 and S/G2 phases in Vialone Nano and Baldo under control and stress conditions. Data are presented as an average estimated from each treatment in five biological replicates with 30,000 events each. Student’s t-test was used to evaluate the significant variations between control and treated conditions for each variety. The reported values are the means of four independent experiments ± standard deviation. Statistically significant variations are shown (*) with p-value ≤ 0.05.

