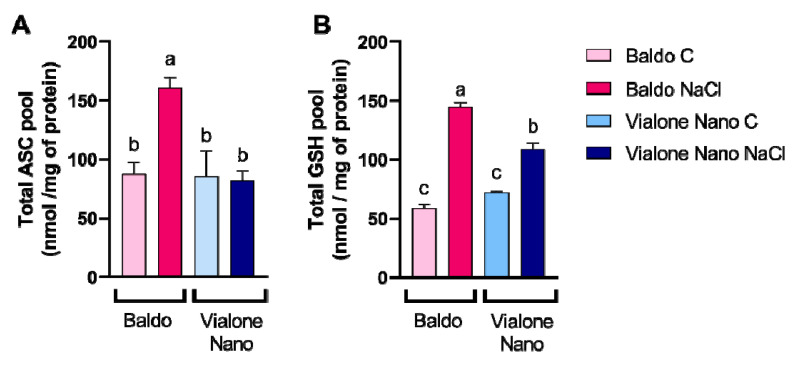
Figure 6.
ASC and GSH levels in rice roots under control and salt conditions. (A) Ascorbate content in control and treated roots (100 mM NaCl). Changes in total levels of ascorbate (reduced plus oxidized forms; ASC + DHA) pools induced by 100 mM NaCl and determined at 24 h after treatment. (B) Glutathione content in control and treated roots (100 mM NaCl). Changes in total levels of glutathione (reduced plus oxidized forms; GSH + GSSG) pools induced by 100 mM NaCl and determined at 24 h after treatment. The reported values are the means of four independent experiments ± standard deviation. Statistical significance was determined by one-way ANOVA followed by a Tukey test (p < 0.01). Different letters indicate significant difference.

