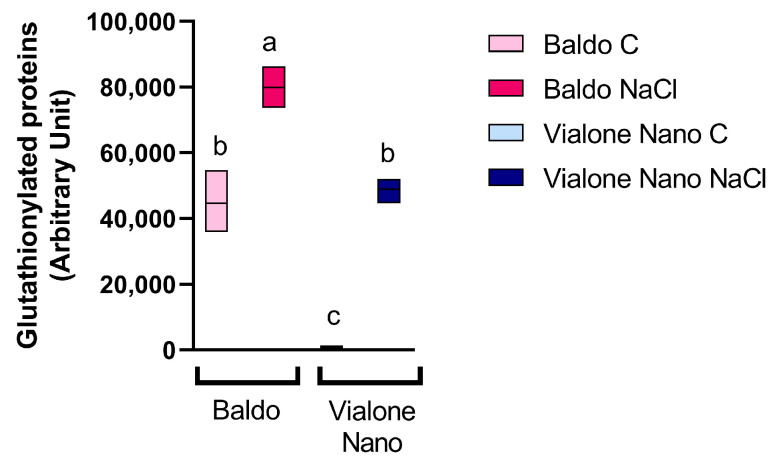
Figure 8.
S-Glutathionylation of root proteins in rice seedlings subjected to salt treatment. Densitometric analysis of S-glutathionylation profile of rice proteins extracted from roots at 24 h from salt exposure. The densitometric analysis was performed and quantified by using ImageLab. The density of the blotting signals was normalized to Ponceau S. The reported values are the means of four independent experiments ± standard deviation. Statistical significance was determined by one-way ANOVA followed by a Tukey test (p < 0.01). Different letters indicate significant difference.

