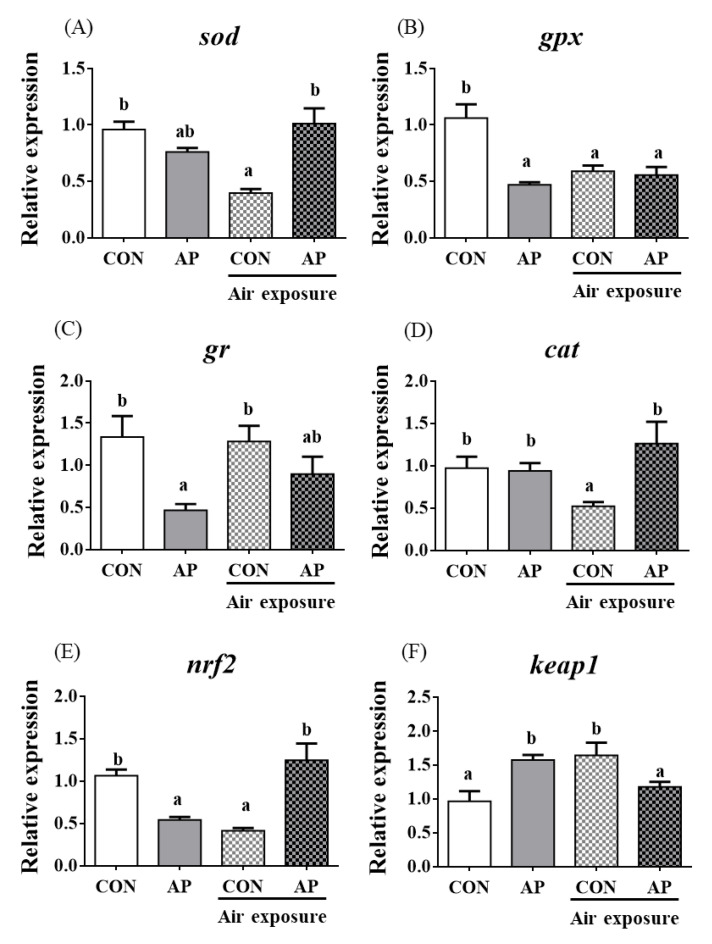
Figure 4.
sod (A), gpx (B), gr (C), cat (D), nrf2 (E), and keap1 (F) gene relative expressions levels of kidney in the two groups before and after air exposure stress. Data are indicated as mean ± SEM (n = 6). Bars with different lowercase letters mean significant differences among groups (p < 0.05).

