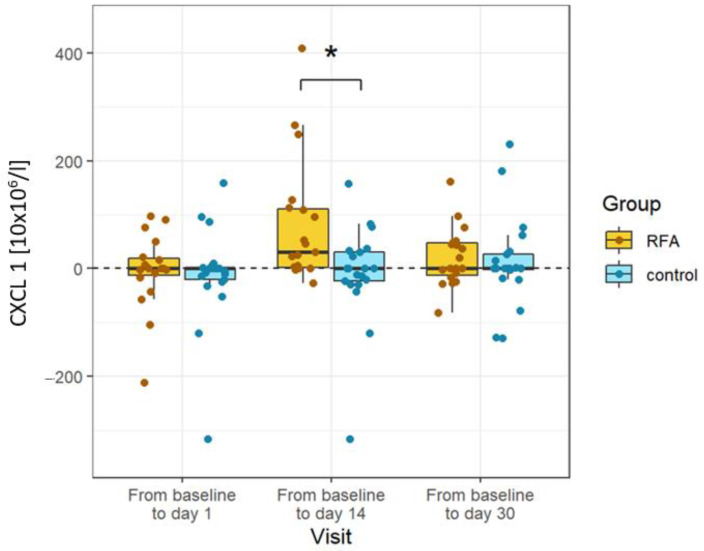
Figure 3.
Changes in cytokines specific to RFA. CXCL1 was significantly elevated in the RFA-treated patients compared to the controls on day 14. Absolute differences from baseline are plotted for different visits using box and whisker plots. The line in the middle of the box represents the median; the upper and lower ends of the box represent the first and third quartiles, respectively. The upper and lower whiskers show the maximum and minimum scores, respectively, excluding outliers. Individual dots represent individual patients’ values. Asterisks show the statistical significance.

