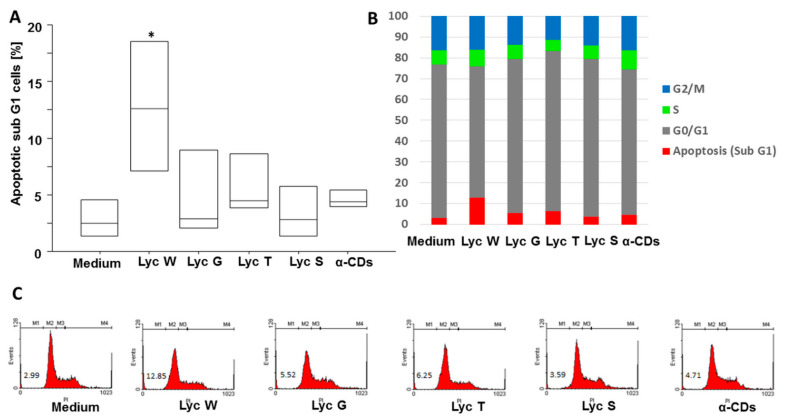
Figure 1.
Flow cytometry analysis on A549 cells for cell cycle. (A) Lyc W significantly increased the apoptotic cells in comparison to medium, Lyc G, Lyc T, Lyc S and to its carrier α-CDs. The results are shown as box-plots with medians (lines inside the boxes). Analysis of variance (ANOVA), Fisher’s PLSD, n = four experiments; *, p-value < 0.05 (B) Representative graph bar with means for M1, Apoptosis (Sub G1), M2, G0/G1, M3, S, M4, G2/M; (C) Representative examples of flow cytometric analysis. The numbers indicate the percentage of positive cells.

