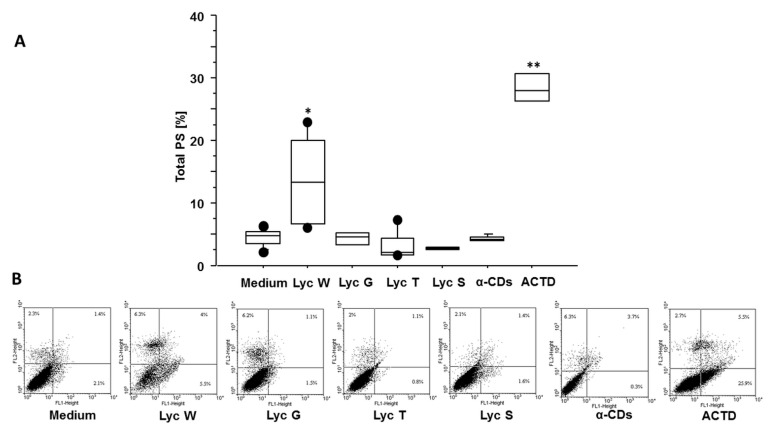
Figure 2.
Flow cytometry analysis on A549 cells for Annexin V test, redistribution of phosphatidylserine (PS). (A) Lyc W significantly increased total apoptosis in A549 cells in comparison to medium, Lyc G, Lyc T, Lyc S, its carrier α-CDs and to ACTD. The results are shown as box-plots with medians (lines inside the boxes). Analysis of variance (ANOVA), Fisher’s PLSD, n = four experiments; *, p-value < 0.05, **, p-value < 0.01 (B) Representative examples of flow cytometric analysis for percentage of positive cells: the numbers indicate the percentage of positive cells for PS, both early and late apoptosis (LR + UR quadrants). FL1-heights, Annexin V; FL2-heights, PI.

