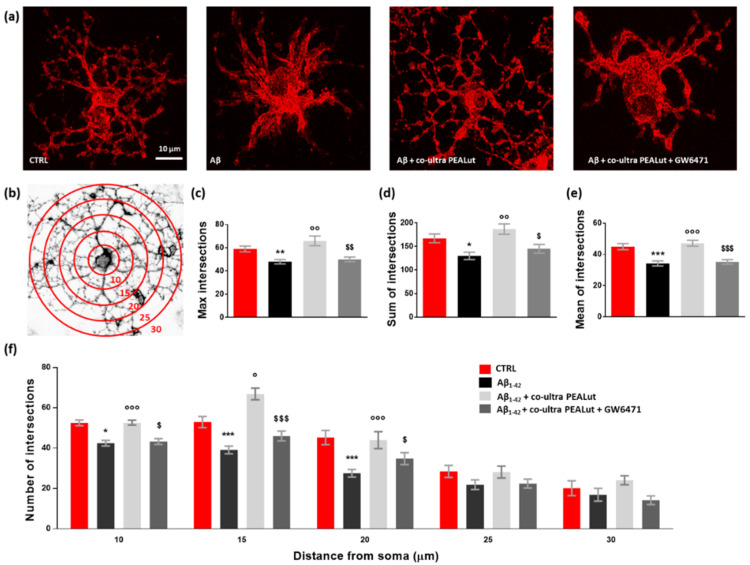
Figure 6.
Co-ultra PEALut limits the Aβ1–42-induced alterations in oligodendrocyte morphology. (a) Representative photomicrographs of MBP+ cells taken using a 40× objective mounted on a fluorescent microscope. Scale bar is 10 μm. (b) Eight-bit image of a representative MBP+ cell, used in the Sholl analysis, in which concentric circles were juxtaposed on each MBP+ cell starting from 10 μm far from the cell soma and spaced 5 μm apart. (c) Maximum number of intersections, that is the highest number of processes/branches counted in each MBP+ cell. (d) Sum of intersections, that is the number of intersections counted in each circle. (e) Mean of intersections, that is the ratio sum of intersections /number of circles. (f) Number of intersections counted every 5 µm starting from 10 μm far from the cell soma until 30 μm. At least 20 cells per animal were counted. Data are plotted as mean ± SEM. * p < 0.05; ** p < 0.01; *** p < 0.001 vs. CTRL; ° p < 0.05; °° p < 0.01; °°° p < 0.001 vs. Aβ1–42; $ p < 0.05; $$ p < 0.01; $$$ p < 0.001 vs. Aβ1–42 + co-ultra PEALut (SNK).

