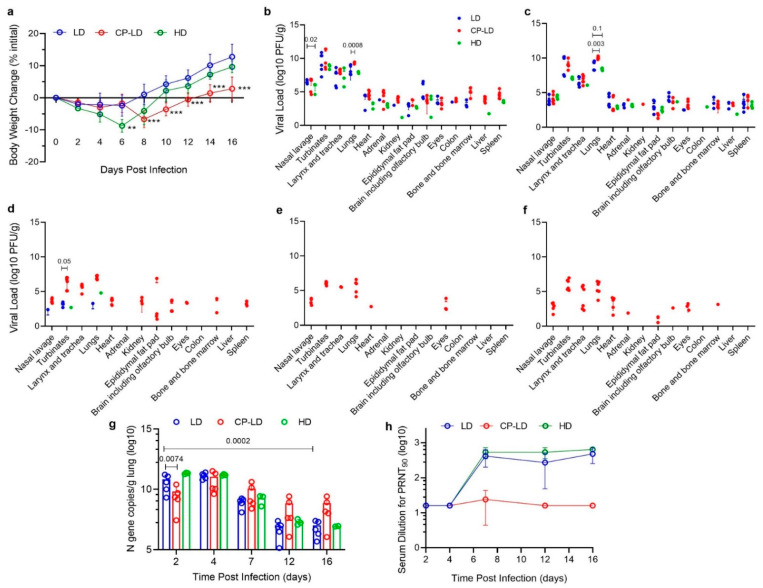
Figure 1.
COVID-19 disease in SARS-CoV-2-infected hamsters. Comparison of body weight change (a) in LD (102.5 PFU, n = 30), HD (105 PFU, n = 15), and CP-LD (immunocompromised; 102.5 PFU, n = 30) SARS-CoV-2-infected hamsters over 2–16 dpi. Median weight change (g) over 2–16 dpi, compared to weight at the time of infection. Comparison of viral load (b–f) in SARS-CoV-2-infected hamsters (LD vs. HD, and LD vs. CP-LD) at 2–16 dpi, expressed as PFU/g of tissues. The expression of SARS-CoV-2 N gene copies/g of lungs over 2–16 dpi in LD, HD, and CP-LD-infected hamsters (g). Kinetics of plaque reduction neutralization titer in hamster sera collected at 2–16 dpi (h). Data represent mean ±SD. and each dot represents data from an individual hamster. LD and CP-LD; n = 4–6, HD, n = 3 per time point; only animals that showed a positive response were included in the plots. Statistical analysis was performed by one-way ANOVA with Tukey’s multiple group comparisons. ** p < 0.01; *** p < 0.005. Significant p-values in (b–g) are indicated above the plots.

