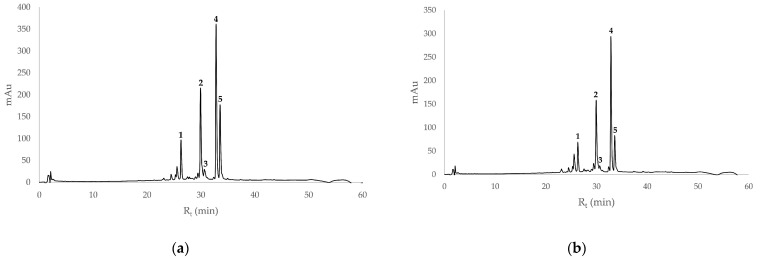
Figure 2.
HPLC chromatogram of sea buckthorn juice from Tuscany (a) and from Friuli-Venezia Giulia (b) at 360 nm. Peak 1 had a mass spectrum with a base peak of 787.2327 m/z and a secondary peak of 463.1246 m/z. Peak 2 had a mass spectrum with a single peak of 625.1782 m/z. Peak 3 had a mass spectrum with a base peak of 303.0511 m/z and a secondary peak of 465.1051 m/z. Peak 4 had a mass spectrum with a base peak of 625.1776 m/z and two secondary peaks of 479.1198 m/z and 317.0654 m/z. Peak 5 had a mass spectrum with a base peak of 317.0646 m/z and two secondary peaks of 479.1191 (M + H) and 501.1024 (M + Na).

