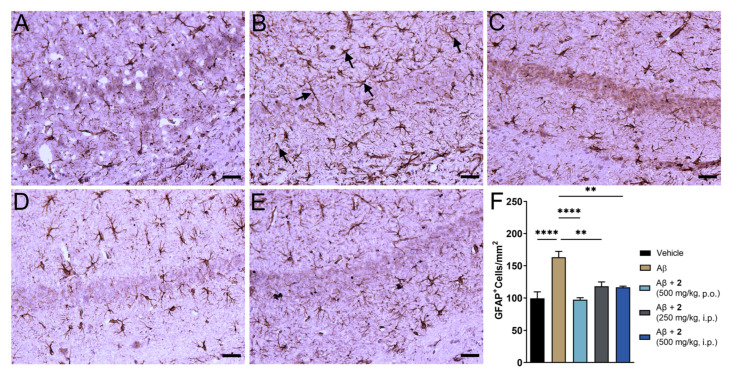
Figure 5.
ψ-GSH dipeptide (2) treatment reduced reactive astrogliosis in i.c.v. Aβ1–42 injected mice. (A–E) Representative images of reactive astrocytes visualized by GFAP antibody in hippocampus region of various treatment groups: saline (A), Aβ-only (B), Aβ + 2 (500 mg/kg, p.o., C), Aβ + 2 (250 mg/kg, i.p., D) Aβ + 2 (500 mg/kg, i.p., E). (F) Quantification of GFAP staining in the hippocampal region of all treatment groups. Data are shown as mean ± SEM. For comparisons between groups, a one-way ANOVA with Tukey’s post-hoc test was used for data analysis. ** p < 0.01, **** p < 0.001. Black arrows in panel B display typical GFAP positive staining of reactive astrocytes. All scale bars represent 25 μm.

