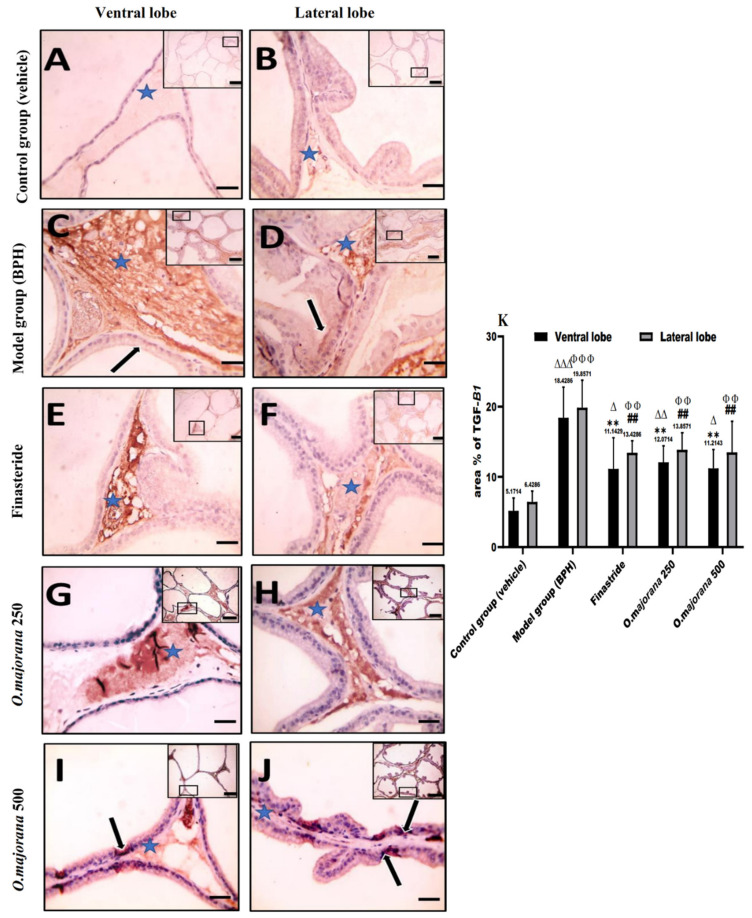
Figure 10.
(A–K): Histological changes in prostate lobes (immunostained prostate sections against (TGF-B1)): Microscopic pictures representing sections of comparable regions in ventral and lateral lobes of the control group (A,B), (BPH) group (C,D), finasteride group (E,F), O. majorana 250 group (G,H), and O. majorana 500 group (I,J). Blue asterisk points to positive interstitial stroma, and black arrows demonstrate positive epithelial immunoreactivity. IHC counterstained with Mayer’s hematoxylin. X: 100 bar 100 μm (low magnification) and X: 400 bar 50 μm (high magnification). (K) A graph showing mean area % of actin in the studied groups. Data are expressed as mean ± SD (n = 8). ** p < 0.01 versus BPH (model) group and ∆ p < 0.05, ∆∆ p < 0.01 ∆∆∆ p < 0.001 versus control for ventral lobe, ## p < 0.01versus BPH (model) group and ΦΦ p < 0.01, ΦΦΦ p < 0.001 versus control for lateral lobe.

